Eve Paulson

Eve Paulson is a student at Harvey Mudd College currently completing her research at University of Delaware - Newark under Dr. Colton Lynner.
This summer I will be working on using a technique called shear wave splitting to look at flow directions in the mantle beneath the Aleutian arc volcanoes in Alaska. The volcanoes in this area generally get smaller moving east to west and also tend to produce different lavas. In the eastern part of the arc, the volcanoes produce lavas that contain evidence of recycled surrounding material like sediments, while the volcanoes in the western part of the arc show very little recycling. Right now, the reason for the differences in size and lava composition isn’t well known. I will be looking for correlations between mantle flow and the volcanic trends in the Aleutian arc. From there we can investigate whether trends in the volcanoes at the surface can tell us anything about the structure of the subsurface. It's possible that these surface volcanoes are related to the flow and thermal structure of the mantle, which can also give us insight into how magma, water, and other volatile gasses move in the subsurface. These methods could be applied to other locations where we have unexplained differences in volcanoes that are part of the same system to further develop our understanding of the relationship between surface volcanoes and mantle wedge dynamics.
July 15, 2022
July 15th, 2022
One frustration I have been dealing with this summer is being able to stay focused while looking at hundreds of earthquake signals per day. I often find myself getting bored and distracted, but recently I’ve found that listening to something while I work really helps. I have listened to a couple of audiobooks along with music genres that I find helpful for focus. Despite struggling to stay focused, I’m really proud of my progress this summer. I have processed earthquake data from nearly 100 stations already and I’m ready to move on to trying to interpret that data.
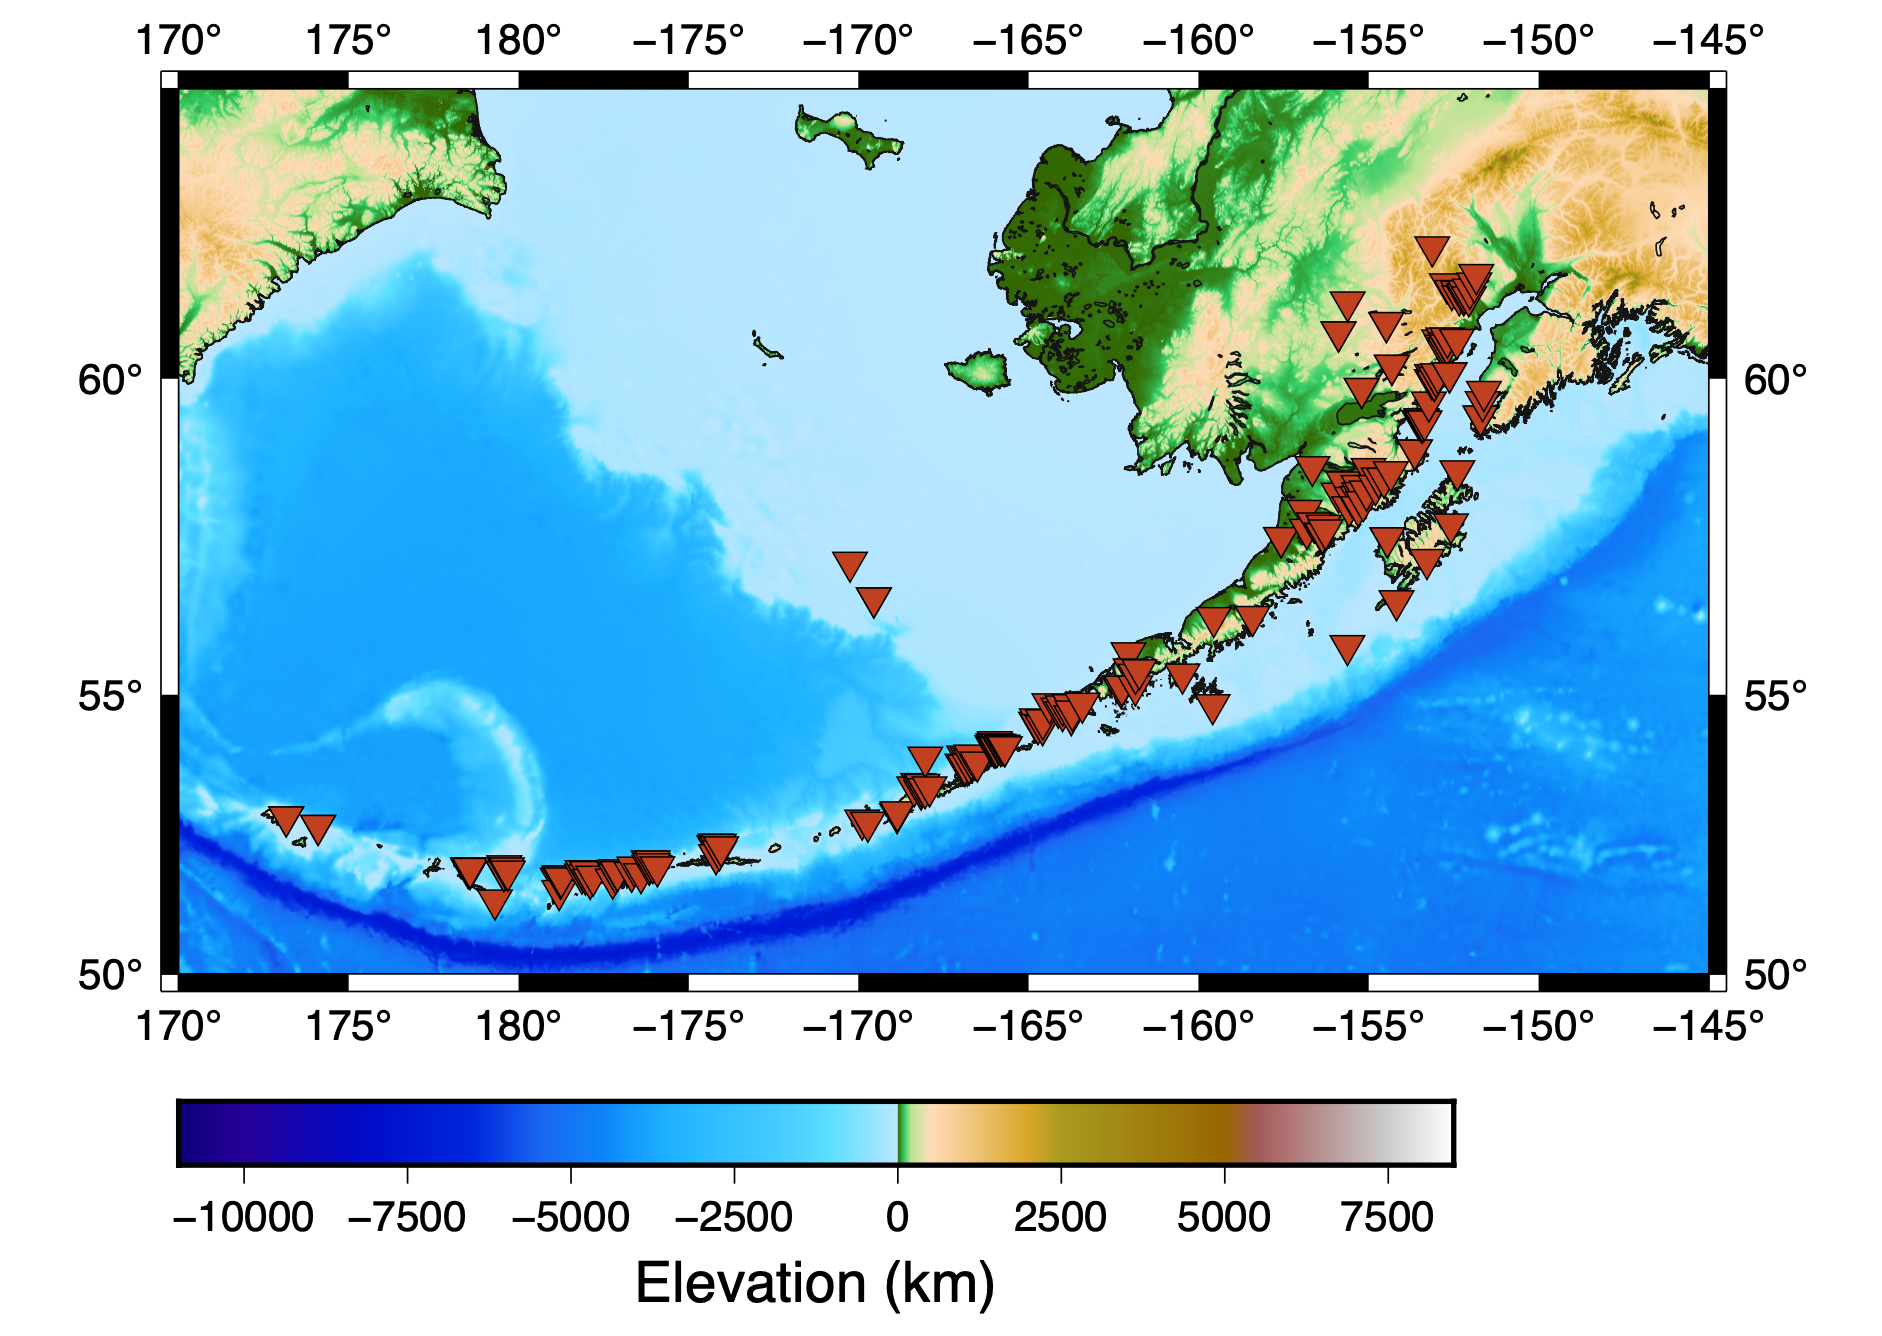
Here is a map of my research area, with the locations of the stations we looked at plotted as inverted triangles.

To create this map, I used GMT (Generic Mapping Tools). Studying this area is important because many of the previous shear wave splitting studies in Alaska focused on the mainland part of the state or used SKS waves. Our project focuses on the Aleutian Islands and uses direct S-wave splitting so we can pick out more of what’s going on in the shallower parts of the mantle.
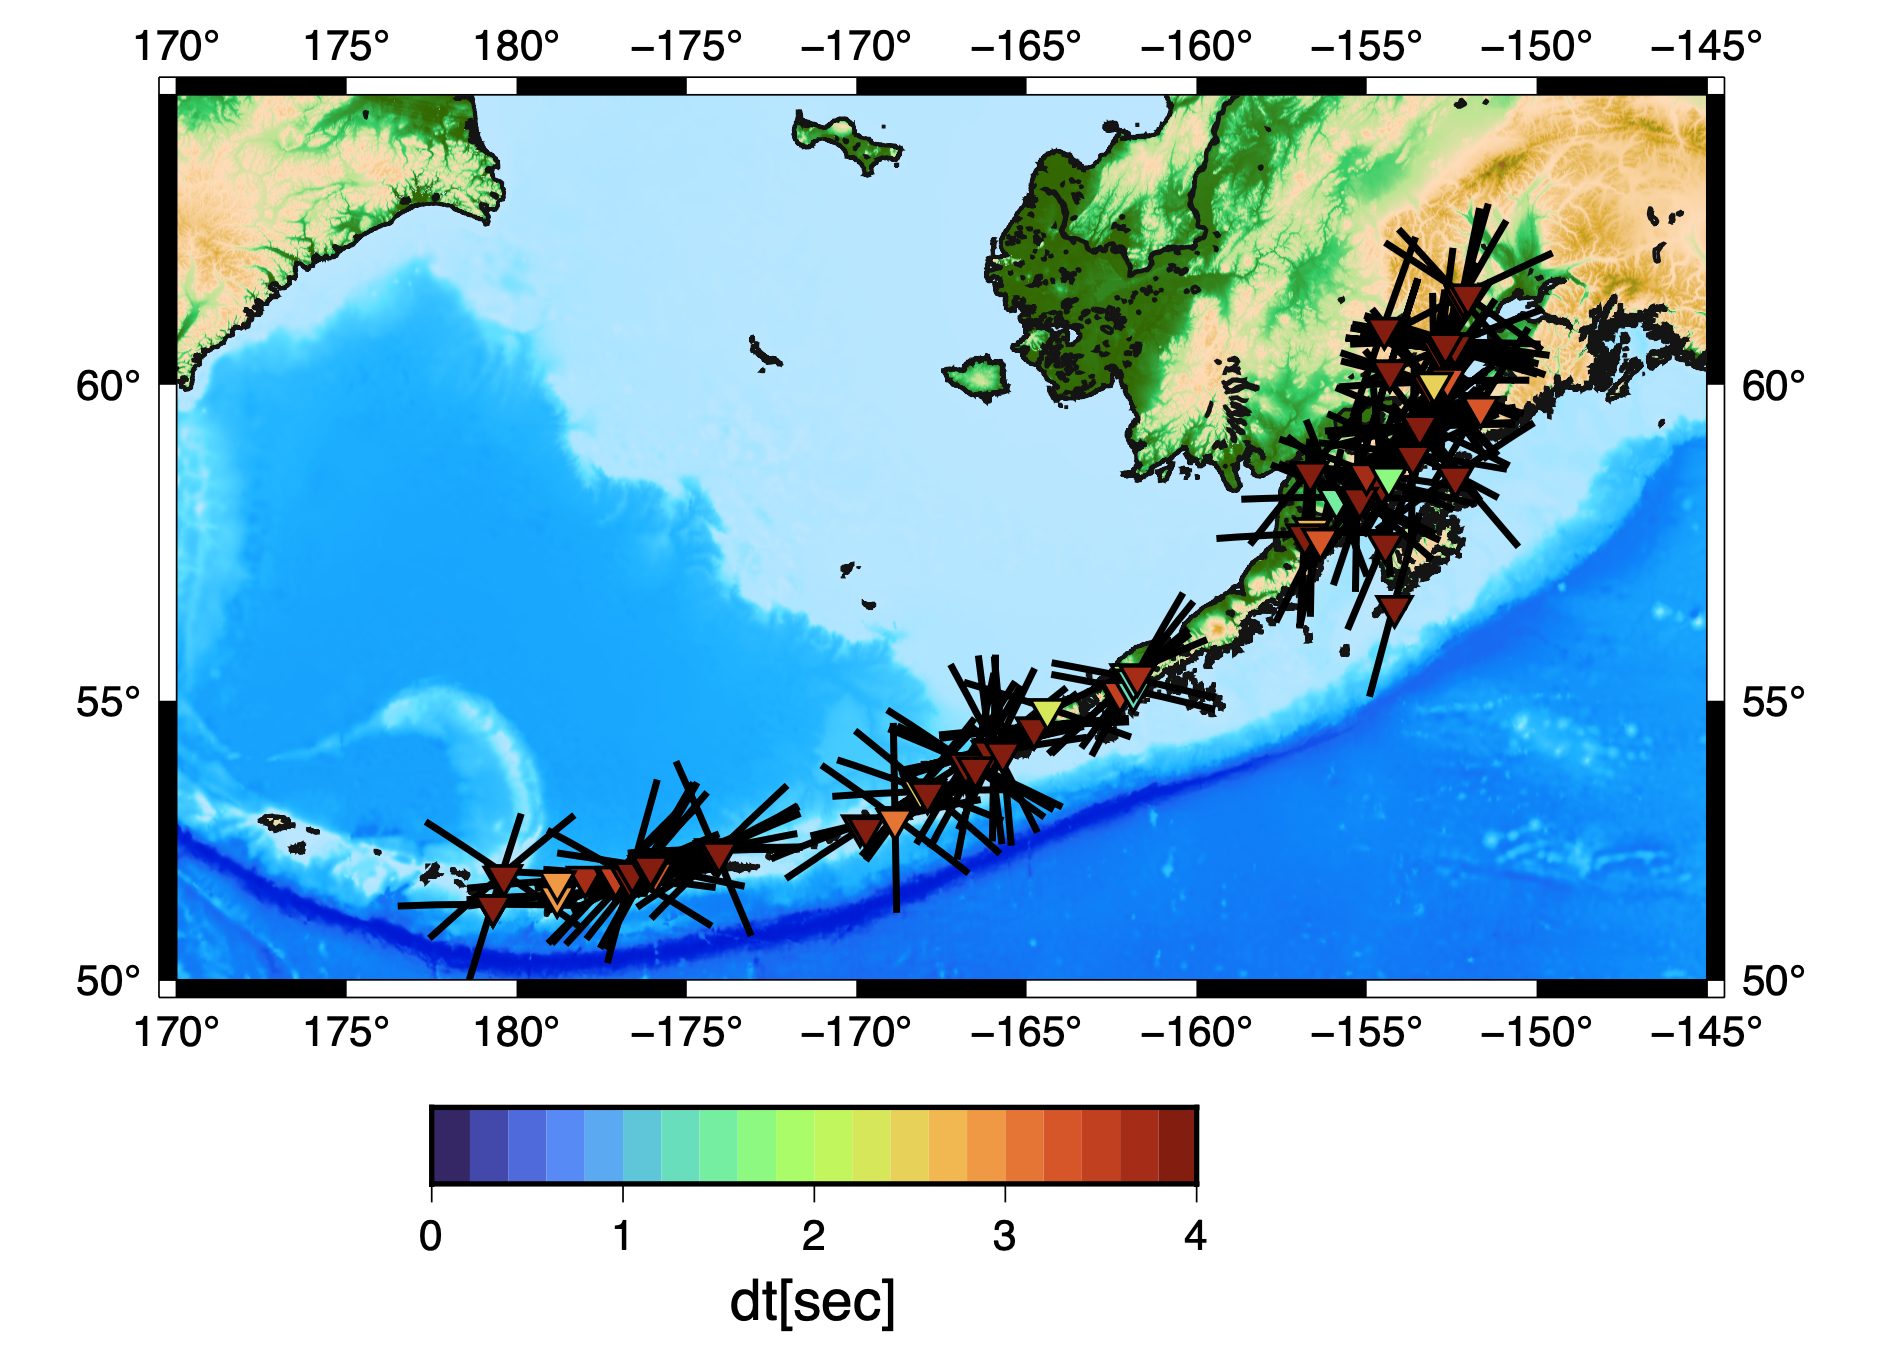
This past week, we have started to work on producing figures that will eventually be used on our poster at AGU. While these are not final, I’ve included one of the images we’ve produced. This figure is unlikely to be used in our final paper since we will probably want to plot our splits somewhere other than where they were recorded. This would probably be where the earthquakes happened or at the midpoint between the earthquakes and the stations.

Fig. 1 - Map of fast directions recorded at each station. Black bars are aligned with fast directions and are plotted at the location of the station where they were recorded. The color of the triangle in the center of the bar corresponds to the delay time.
A paper that has been central to our project this summer is Erin Wirth and Maureen D. Long’s “Frequency-dependent shear wave splitting beneath the Japan and Izu-Bonin subduction zones” (2010). This paper also uses direct S waves instead of the more traditional SKS waves to analyze a subduction zone. Like with our research in the Aleutian Islands, their goal was to better understand the geometry of the mantle wedge in the subduction zone. However, they also looked at the effect of looking at waveforms in different frequencies, while our research only focuses on one frequency range. In their paper, they found both trench-parallel and trench-perpendicular fast directions at different places along the subduction zone. Trench-parallel directions tended to be closer to the trench, which Wirth and Long gave a few possible explanations for, one being B-type olivine fabric and another being trench-parallel flow. We will be looking for these trends in our research in the Aleutian Islands and comparing our results to what they found in Japan.
June 27, 2022
June 27th, 2022
Working on an elevator pitch for my project was difficult for a few reasons. I still don’t have any real sense of what I will find from my research this summer, so I don’t have a nice conclusion that I can offer right now. It was also hard to come up with something to say for a full minute but at the same time hard to explain the technical terms in only one minute. Having a way to explain my project to different types of audiences will help me communicate the work I’m doing to my family, friends, potential employers, other scientists, and anyone else who will listen. It will help me network and explain the skills I have. However, to have an elevator pitch that is understandable and engaging, I think I will definitely have to keep working on it over the course of the summer.
Here is a photo of my desk and the view out the window!

June 17, 2022
June 17th, 2022
I am looking at seismograms recorded in Alaska along the Aleutian Islands. We are only looking at broadband data, which isn’t recorded at every station. This data is available through IRIS. Many of the waveforms I will be looking at this summer were recorded by stations intended for monitoring the volcanoes. Thanks to these seismometers installed to keep track of volcanic activity, there is an abundance of data collected on earthquakes around the Aleutian arc. Unfortunately, since many of the seismometers are on small islands, there is a lot of background noise in the seismograms from waves and other sources that make the waveforms harder to interpret. Thanks to Splitlab, the software I’m using, there’s a built-in filter capability that helps us get rid of some of the noise. Splitlab also predicts when it thinks the s-wave will arrive, but ultimately it’s our responsibility to pick the arrival from the waveform. Due to the delicate nature of shear-waving splitting measurements, we only get a good measurement from very few of the seismograms we look at, even with all the help from the software. Over the summer, I will look at data from around 100 stations in the western half of the arc, and Cherilyn, who is working on a similar project, will look at 100 more from the eastern half. A given station has data from anywhere from 30 to over 600 earthquakes, depending on how long it has been active.
One skill I have already had to develop this summer is being able to work independently, specifically in monitoring my progress towards my goals and changing my plan to achieve them as needed. To me, demonstrating this skill means having clear and realistic expectations for yourself that are actually possible to meet and then being able to adapt when errors and problems arise. This skill is essential to develop because being able to manage my own schedule will be useful in any future career I have. This week was our first week working independently on data collection, so I am now working essentially on my own schedule. At first, I didn’t really have a sense of what was a reasonable amount of work to expect myself to get done in a day, but as the week has gone by, I’ve gotten a better sense of my capabilities. Next week I will set daily goals and monitor how well I stick to those goals.
June 13, 2022
June 13th, 2022
As I head into my second week, I’m getting a better sense of where my project is headed. This summer, there are a few things I hope to accomplish. During the first few weeks of the summer, I hope to learn more about seismology in general since it’s an area of geology that I don’t have a lot of background in. I will spend some time looking into the literature on shear-wave splitting and anisotropy in the mantle so I have some context for the splitting measurements I’m taking. Learning how to read scientific papers effectively and efficiently is definitely something I am hoping to achieve this summer.
The middle few weeks of my summer will focus on data collection, which we started this past week. We have been using the software Splitlab to help us with our measurements. I’m already much more comfortable with interpreting seismograms in general, and I’m starting to be able to interpret what I’m seeing more quickly. I look forward to continuing to develop those skills throughout the summer.
At the end of the project, we will be able to interpret the data we collected and start looking for relationships between surface volcanoes and mantle dynamics. At this point, I will need to develop a better understanding of the volcanism in Alaska, which will involve reading a lot more scientific papers, giving me another chance to develop those skills. I also want to learn more about volcanism in general since it’s an area of particular interest to me. By the end of the project, my goal is to have a cohesive conclusion about the relationship between surface volcanoes and the flow patterns in the magma below them, and then be able to write an abstract and create a poster on the topic for AGU. I also want to learn how to produce readable and informative figures that will then be used in my poster for AGU and maybe even in a paper later on.
Throughout the summer, I am also hoping to find out if research is something I want to continue doing, especially when thinking about graduate school. If I want to go to grad school and continue with research, I also hope this summer can help me determine if seismology is the right area for me. While these are my goals right now, I am sure I will learn much more along the way, and I can’t wait to see what happens this summer.


