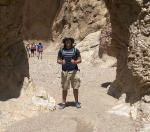
Jonathan Guandique

Jonathan Guandique is a student at Fort Valley State University currently completing his research at University of Maryland under Dr. Scott Burdick.
Seismograms pick up things other than earthquakes, although earthquakes are the main focus. Ocean waves, winds hitting trees, vehicles and human activities create signals that the seismograms can pick up. Signals are affected by time of day, seasonal variations in weather, and the location of the seismogram to the oceans/glaciers. All these signals can be seen as noise, and is very unwanted in terms of seismological data. Interpreting noise from useful data is difficult, such as distinguishing between rustling trees in the wind and a small earthquake thousands of miles away. This project revolves around the analysis of this seismic noise, and get a better understanding in interpreting the noise. The ultimate goal will be to produce a way of accounting for and generating synthetic noise that is compatible with characteristics inferred from these analyses.
Time is of the Essence!
June 29th, 2015
It is amazing how quickly these past five weeks have gone by. While they have flown by, there is still much to do. It seems that every week, we add something new to the script, where we can gather more and more information and analyze more and more data. But while this is convenient, it is also very time consuming.
The Matlab script that my mentor and I have come up with is one that obtains data from each station during a specidfied time period, and plots it in several plots that display the signals, noise and all, that have been picked up during that time period. This is useful when analyzing any changes over the course of the year. However, because it is a lot of data, it takes quite a while to actually get through all the stations and plot them. Also, another kink that I have noticed is that the porgram overwrites the previous graph with the most recent graph, which makes comparing station to station spectra rather difficult. This is something we can hopefully resolve soon, for time is of the essence.
Week 3/4 of “Independence
June 18th, 2015
This week and last consisted of essentially writing scripts to collect numerous amounts of data and plot them. We are not looking for the biggest earthquake evver, quite the opposite. We are looking for noise...and the consistency of noise at ceratin stations throughout the year. We want to see if trends in noise is the same annually, and would like to see patterns...because patterns in data is good. Patterns would make my life so much easier (:
Here is a little sample of what the script (which was started for me...well basically almost done for me, as my understanding of matlab scripting has marginally increased. I would like to note that I did put the finishing touches on it...yay) does for a sample of data from December 16th, 2013.
Week #2 blog
June 5th, 2015
It has been quite a climate change from New Mexico to Maryland. It has been so dreary and rainy this past week that it makes me miss New Mexico's dry weather. Anywho, I was finally able to meet my mentor and his associates and some of the grad students here in the lab. All of them are great people, each with differing personalities (but who wants to have the same personality as someone else? different is good). As for what I have done personally this week.... lets just say that its taken me quite a bit to read these papers and get a better understanding of what the whole project is about. While it is a difficult concept to get a grasp of, it's very interesting. Apart from reading, I was also getting some more exposure to Matlab, seeing how I am not very adept at it. While my first week hasn't been very eventful, I'm enjoying the learning that I am doing now.
As for my reasearch, I plan to start looking at data next week, adn actually be able to graph an interpret it. This will probably consist for the first third of my internship. For the second third of my internship, I plan to work more on Matlab and actually collect some data here locally, which is exciting. By the end of the final third section of my internship, I hope to have a good grasp on my topic and know enough about my project so that I can actually give a decent presentation..... as of right now....I wouldn't be able to tell you much other than, we have data and doing things with it!
Bloooogogogogog
May 28th, 2015
I can finally do things. After 10 agonizing minutes of waiting for passwords reset (not really....I really just used my time sitting to look up a good profile pic...no luck though, my pictures SUCK), I'm able to post this! Orientation week: much better than I expected! Maybe I should've read the itinerary, but these field trips are great! Hiking, sweating, being out of breath, almost dying from slipping on rocks...this is what made this orientation week fun. Oh and the interns I've acquainted myself with are ok I suppose (Just kidding, you guys are great). There was never a time where I went hungry, whcih was both good and bad. The pros are that I ate soooooo much, the cons are that I are soooooooo much. But it's all good though, because I like food and food is delicious, therefore I eat delicious food. I can't wait to start my research with my mentor! (:


