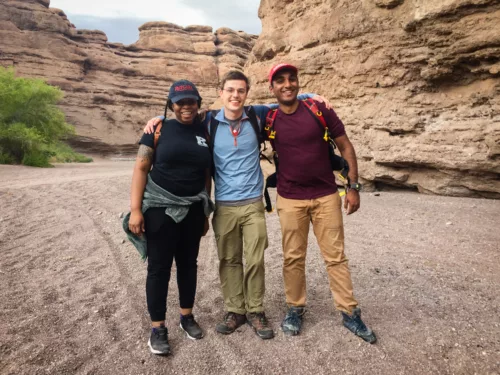
Jackson_Fellows is a student at Cornell University currently completing research at University of New Mexico under Lindsay Worthington.
The goal of this project is to develop a seismic velocity model of the accretionary prism offshore of Kodiak Island, Alaska. This area, where the Pacific Plate subducts under the North American Plate, is very seismically active. Our study lays within the rupture zone of the 9.2 Mw Great Alaska megathrust earthquake of 1964. By combining dense on-land nodal array data with marine airgun shots (both acquired during the 2018-2019 Alaska Amphibious Community Seismic Experiment) we hope to develop a more detailed velocity model than previous researchers. This model could help scientists better understand and mitigate earthquake hazards in the region.
Here’s one of my best fitting velocity models so far. It shows seismic velocities along a 2D cross-section offshore Kodiak Island 250 km long and 60 km deep. The colored lines plotted on top are the calculated ray paths of seismic energy from their sources (airgun shots) to their receivers (the nodal array). When looking at the output of an inversion like this it is important to realize that the model only makes sense where it has inputs. E.g., the discontinuity at ~170 km does not represent a real feature of the Earth and instead is an artifact of the inversion process. The velocities are only constrained where we have travel-time data (i.e. ray coverage). In my final poster I’ll probably plot the velocity model masked by ray coverage instead of showing all of the raw rays like this. Almost 2,000 travel-time picks went into creating this model.
One of the most important papers for my work this summer is Worthington, et. al. “Crustal structure of the Yakutat terrane and the evolution of subduction and collision in southern Alaska”. This paper is very helpful as it contains an example of the use of travel-time tomography to create a 2D velocity model. While the data sources used in this paper are different from mine it provides a great overview of all of the steps involved in going from raw seismic traces to a high-quality velocity model.
This summer I’m looking at data that was collected by the Alaska Amphibious Community Seismic Experiment (AACSE) in 2019. Here’s an overview map I made a few weeks ago of the study area in southern Alaska:
As you can see, there’s a lot going on! The experiment deployed seismometers both on land and on the ocean floor over a wide area. They also performed marine airgun shots and recorded marine data (with bathymetry) over traces with a total distance in the thousands of kilometers. The experiment covers a wide swath of the subduction zone, allowing researchers to further understand what makes some segments different from others. Also shown on my map are historical large earthquake rupture zones, mapped faults, current volcanoes, and depth to the top of the subducting slab (the Pacific Plate). This shows the wide range of processes and dynamics that were spanned by the 2019 experiment.
My project is not focussing on all of the data gathered by the AACSE. I am focussing on the dense array of small seismometers (referred to as “nodes”) deployed on Kodiak Island (colored purple on my maps). My goal is to use these nodes, along with the airgun shots undertaken offshore, to build a velocity model along a profile spanning from Kodiak to the trench. Here is a more zoomed-in version of the previous map (including two possible study profiles):
My project starts with looking at the raw seismic traces recorded by these nodes and hopefully ends with a velocity model along one or both of these lines.
Here’s a cool picture of Mount Rainier that I took while flying back to Albuquerque from Seattle this Sunday. Mount Rainier is a volcano, part of the Cascade volcanic arc produced by the subduction of the Juan de Fuca plate under North America. In addition to producing wonderful mountains, subduction zones can generate massive earthquakes, making their dynamics and geology very relevant for human society. My project isn’t about Mount Rainier, or volcanoes more generally, but it does concern subduction zones. I will be studying the shallow structure offshore Kodiak Island, Alaska where the Pacific Plate is subducting under North America. This region has hosted more Mw > 8.0 earthquakes than anywhere else in the world. My study area lies within the rupture area of the second largest earthquake ever recorded, the 9.2 Mw Great Alaska earthquake of 1964.
This summer I want to learn how seismology can provide us with information about subduction zone structure and processes. What techniques can scientists use to image the subsurface? What sources of data are available? What are their strengths and limitations? While I won’t explore every possible method or source of information, I hope to examine the wide variety of data collected by the Alaska Amphibious Community Seismic Experiment in 2019, including onshore, ocean-bottom, marine, and nodal instruments. I know that I will be specifically using stacking, travel-time picking, and velocity modeling/inversion in my project. If time allows, I hope to also learn more about earthquake relocation and passive-source seismology.
Hopefully, at the end of this summer I will look at the geologic features that have always fascinated me, such as Mount Rainier, in a new light. Instead of merely admiring their surface expression, I hope to have more context of the bigger picture and unseen dynamics. What instruments and computational and mathematical tools allow scientists to understand these systems? Maybe I could answer at least a small part of that question.