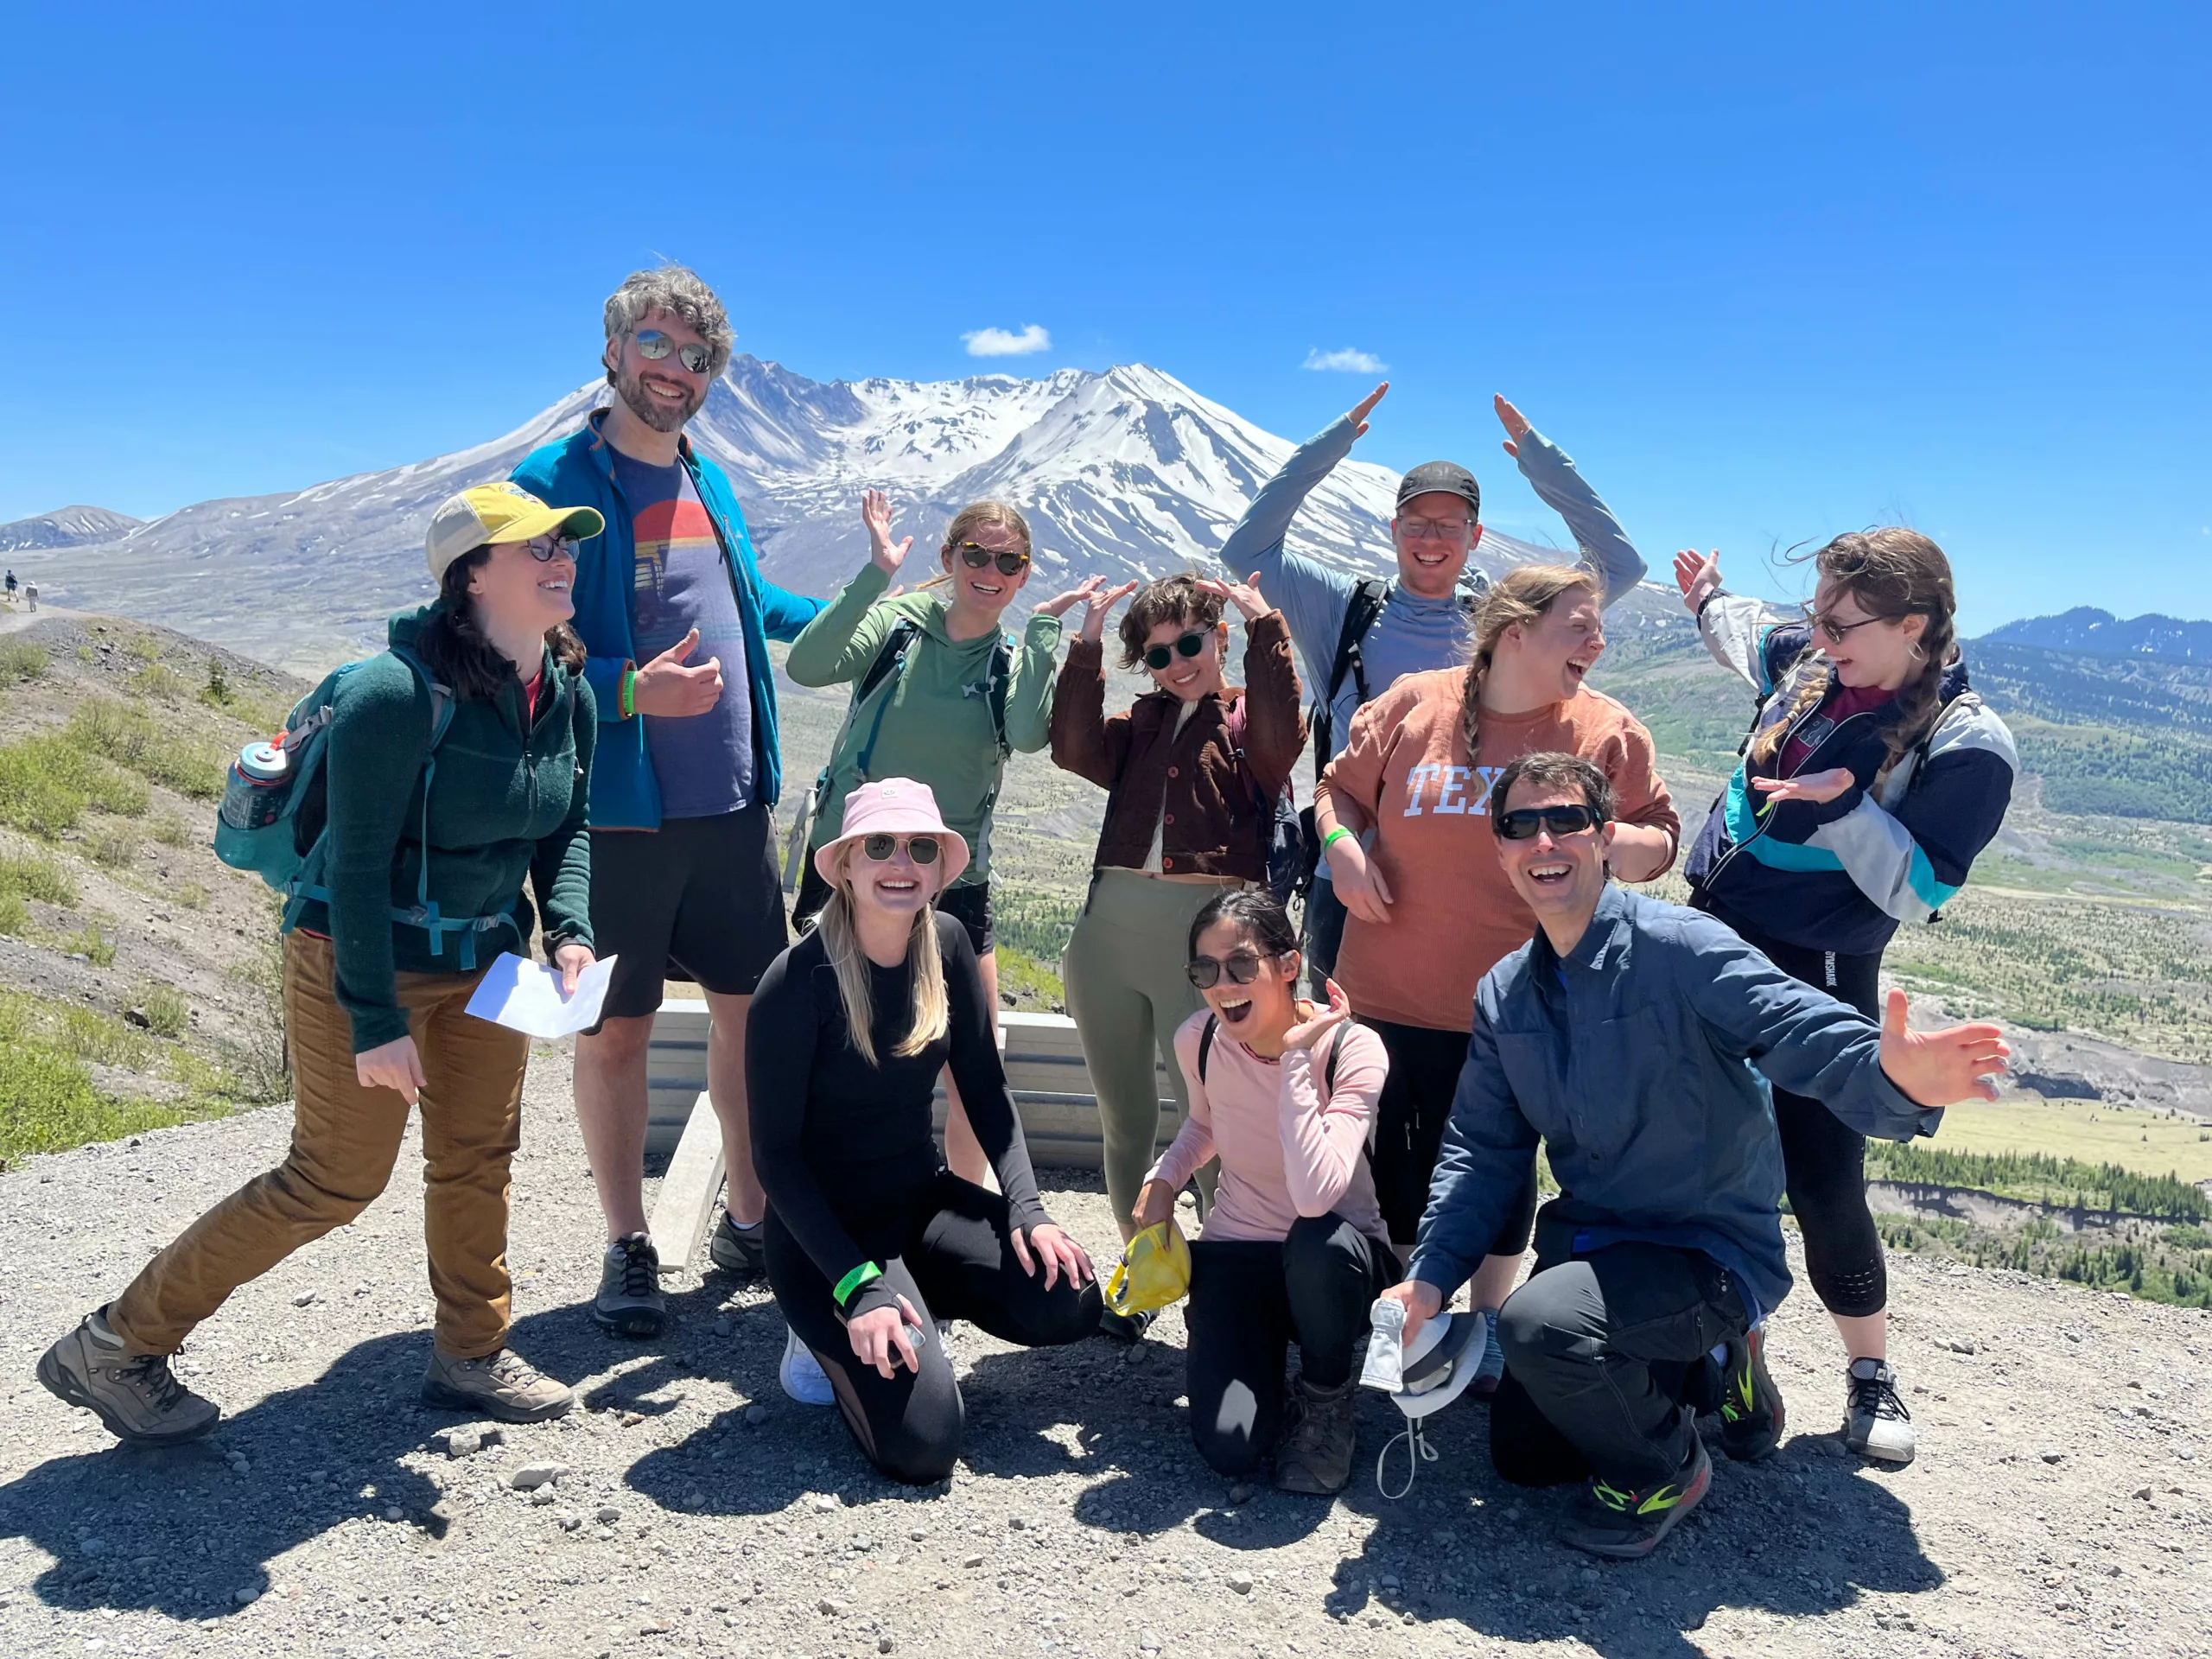
Anah Bogdan is a student at SUNY Potsdam currently completing research at University of California, Riverside under Heather Ford.
The Los Angeles (LA) Basin is a highly populated sedimentary basin that formed due to the interaction between the Pacific and North American plates. Sedimentary basins can enhance the effect of ground motion when an earthquake occurs. We aimed to better characterize the depth of the sedimentary basin via Ps receiver function analysis using a combination of permanent stations and nodal data obtained for the southern half of the basin. We examined data from 24 broadband stations in the Southern California Seismic Network (CI) scattered across the LA Basin. We also examined data from the UCR nodal array that contained 50 nodes spaced 500 meters apart. Despite high cultural noise, Ps receiver functions highlighted the presence of multiple interfaces associated with the basin and crust.
As I enter the final week, I cannot believe how much I have grown this summer. Living over 2,000 miles away from family, doing a geophysical research project with a significant coding portion, meeting new people, and getting ready to present at AGU... I would've never thought I would be doing this.
The goals that I set for myself have mostly been conquered. My coding skills have improved significantly. They went from following a word-for-word document on how to run the Ps receiver functions (RF) for permanent stations to troubleshooting and manipulating the Ps receiver code to work with nodal data. It took me about 8 hrs to learn how to change miniseed files to SAC files and rework the code to cut the files and run the program correctly. When it worked, I was so excited! This was a sure sign that I have progressed and learned something new
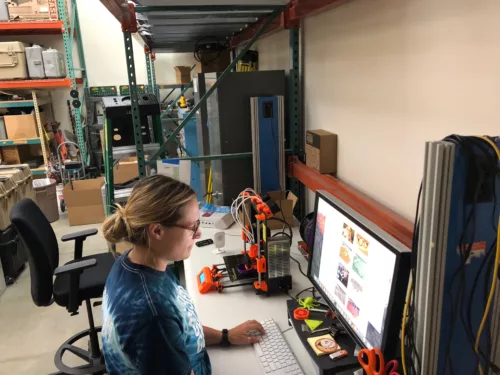
I went from a computer screen that looked like this my first few weeks (below, left) to creating figures that map the structure under the 50 nodes UCR buried in the Southern LA Basin (below, right). We even found faults (black ovals!)
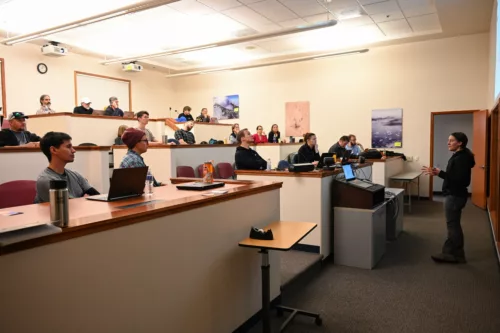
With all the new information comes improving scientific communication. Weekly meetings with Dr. Joseph Byrnes and Leah, gave me the opportunity to update others on how my project is progressing. Also, talking about my project with family and friends that have very little to no geology knowledge has been helpful too. Improving scientific communication is a goal that I can always improve upon, but it has gotten better.
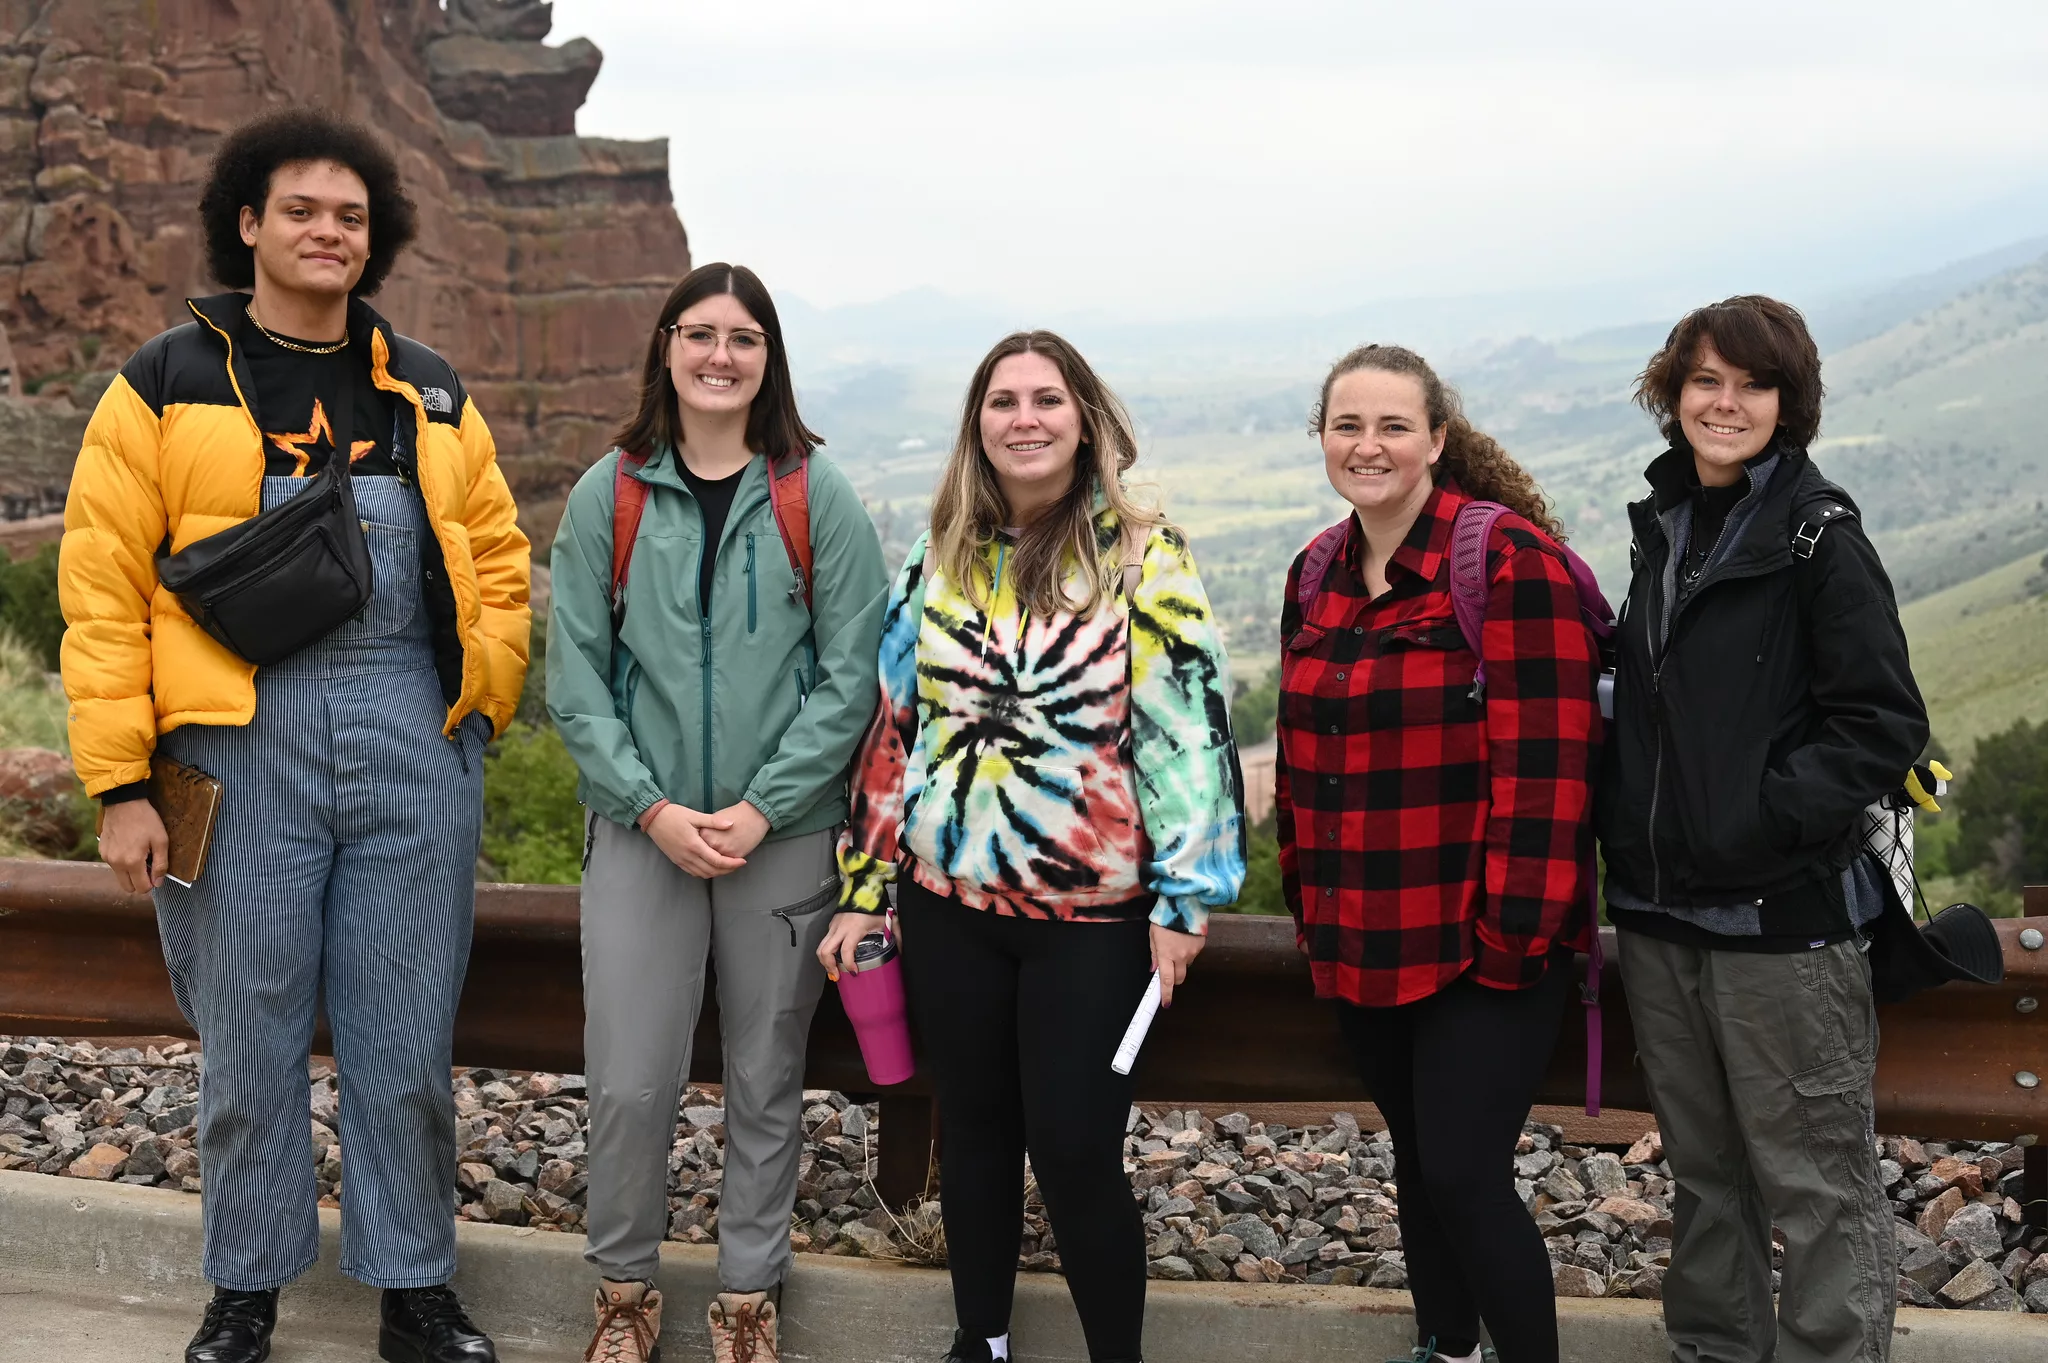
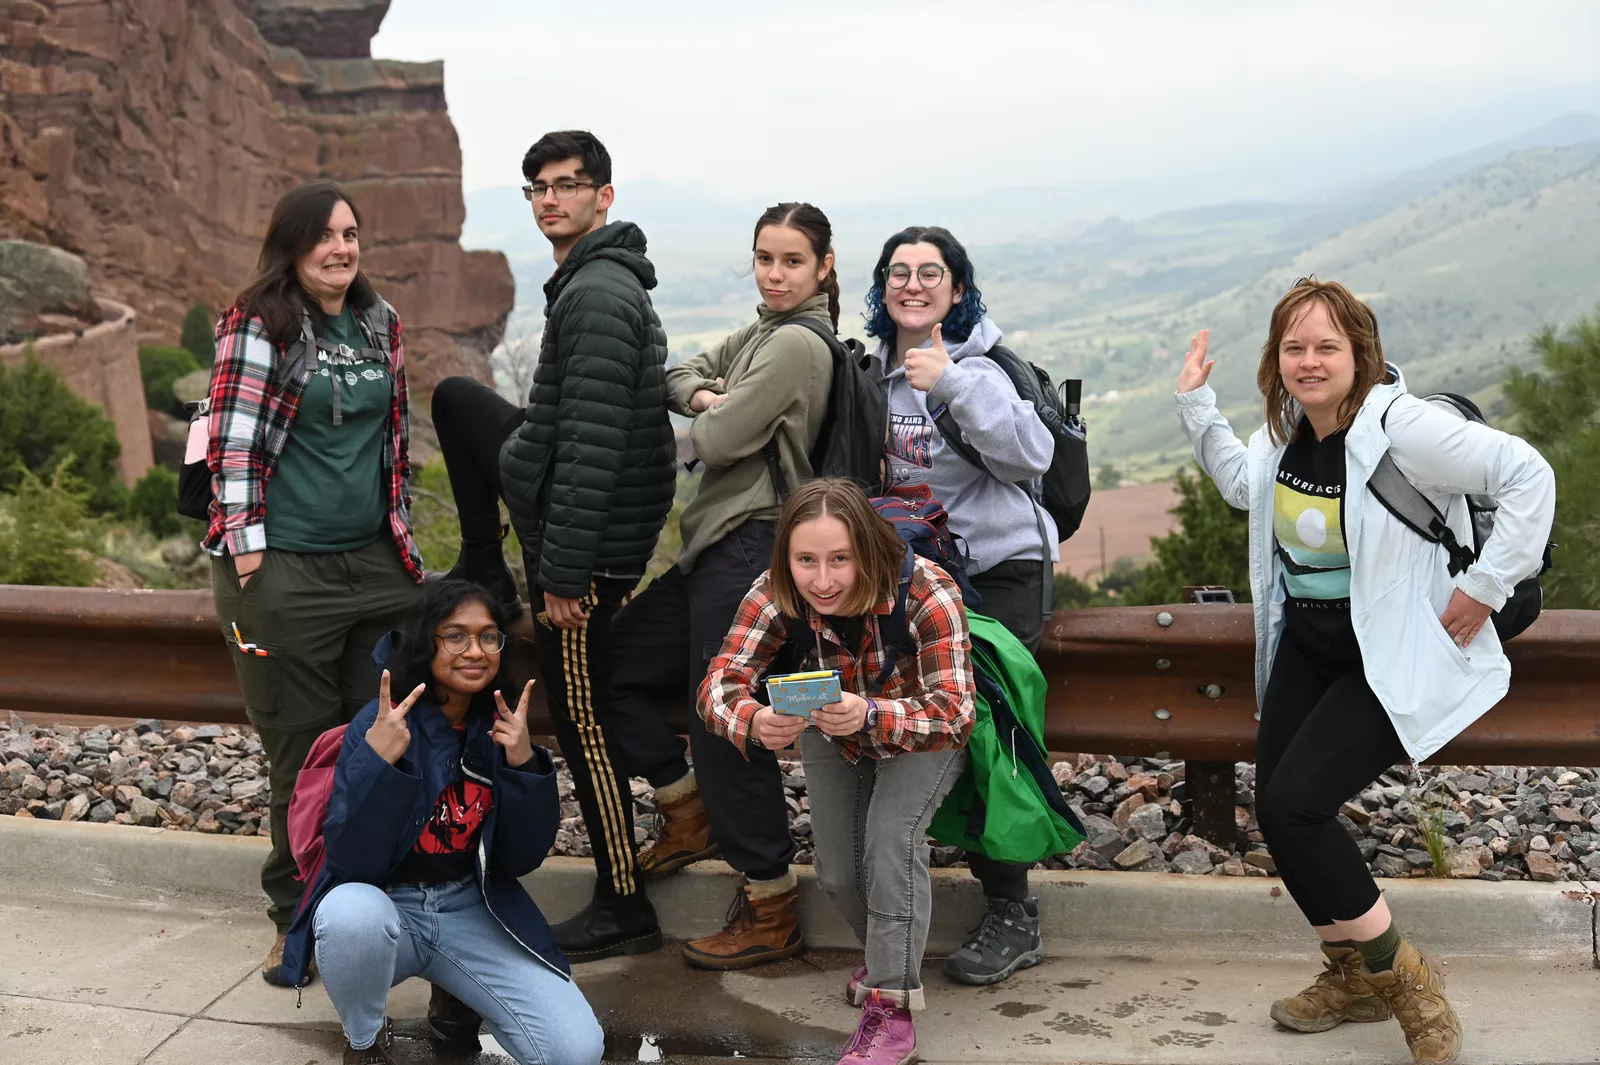
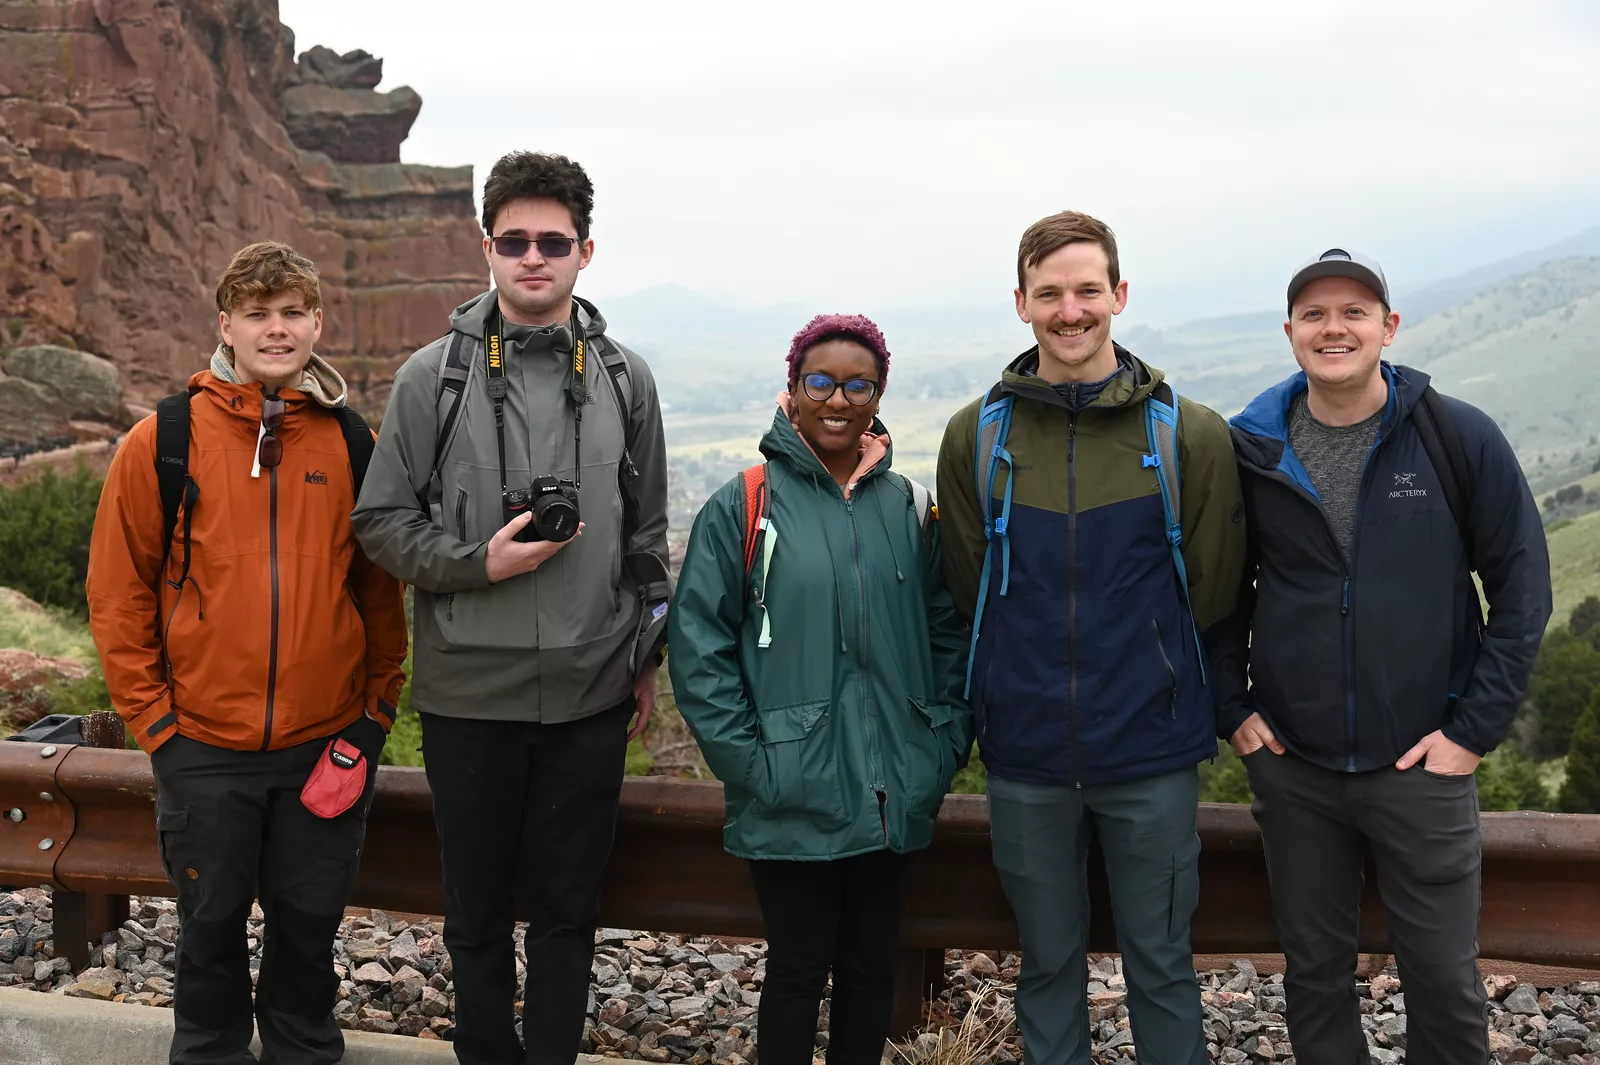
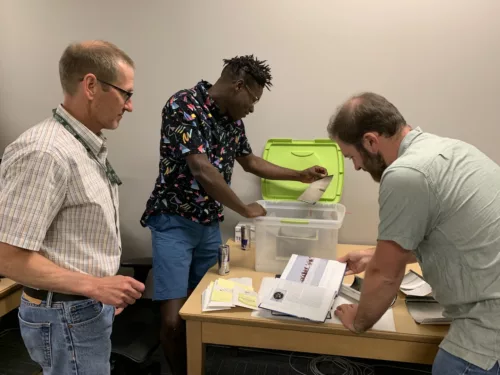
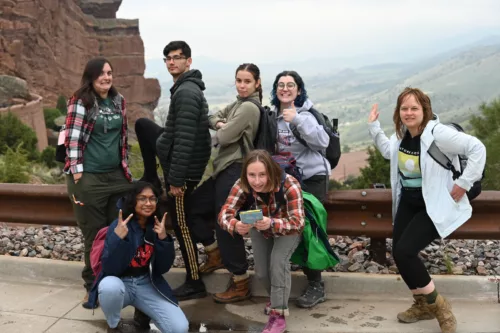
New experiences, meeting new people, and exploration, were conquered. The numerous places I explored, hikes I went on, rocks and pamphlets I collected, and pictures I have taken prove that I accomplished this goal. Photo credits to Jordan, Heather, and Disneyland.
I am still figuring out what I would like to do in the future, however, I do have a better idea of what direction to head in and what I want to do. My end goal is to work for the government or a national laboratory. I am keeping my options open and I may end up attending grad school to do a cool research project like the one I am doing this summer. Receiving advice from others, hearing other people's aspirations, and researching careers are helping me decide the next steps of my future.
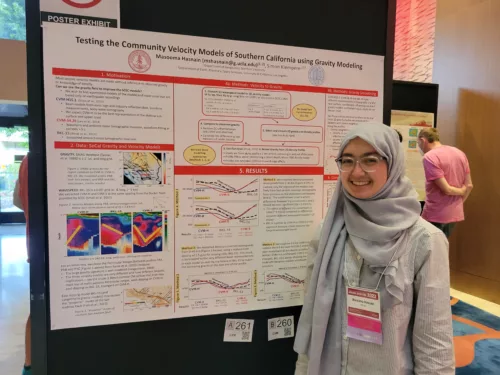
I have learned a tremendous amount and have made good relationships that will last a while. My AGU abstract is submitted, final figures are being edited, the poster is being made, and soon I'll be headed home to start my senior year at SUNY Potsdam. I am very grateful for this opportunity and for the support and growth of knowledge from this experience.
I have reached the half way point of my internship and it is bittersweet. I am excited that I have great figures, but also sad that my time at Riverside is drawing to a close. I am looking forward to going back home, seeing my dog, and telling everyone about my amazing summer, but I will miss this research and the people I have spent time with this summer.
Using the receiver functions I created last week, I interpreted where the sedimentary basin and Moho (boundary between crust and mantle) appear for each station. The figure of station SRN at 3 Hz shows those picks (figure 1). The green line is the direct P-wave arrival, magenta is the sedimentary basin, and cyan is the Moho boundary. This information will be used to interpret the depth of the Moho and sedimentary basin.
Before we interpret depths, we decided to see if there is a correlation between my picks for the sedimentary basin of my stations to the evaluated depths of the basin from Sui et al (2023) supplemental figures. Sui et al studied numerous stations in the LA basin and mapped the Moho and sedimentary basins for almost all the stations I used. As you can see in the chart made from google sheets, there is a relative correlation between the two data sets. I was concerned, but when I saw that my picks were not too far off from theirs my hopes went up! It is great to compare data sets to others for reassurance.
Another paper we have refered to often is Liu et al (2018). Note that references are found at the bottom of this post. This paper compliments what I am doing in the southern portion of the LA basin. They conduct Ps receiver functions on nodal arrays in the northern part of the LA basin to map the depth of the sedimentary basin and Moho. Their background information, figures, and methods has helped me understand the seismic hazard of the sedimentary basin beneath LA and how to interpret my results. Dr. Robert Clayton is one of the authors for this paper and he is the one that suggested to Dr. Heather Ford to participate in this project and implement a study in the southern portion. And that is how I got this project!
I haven't started working on the 50 nodal deployment yet, but it sounds like I will start that soon. We first have to figure out how to convert the miniSEED files to SAC files, so I can run the code. I am also working on writing an abstract for AGU, which I am very excitied to attend!
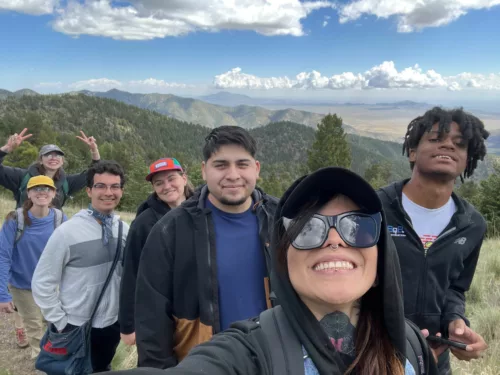
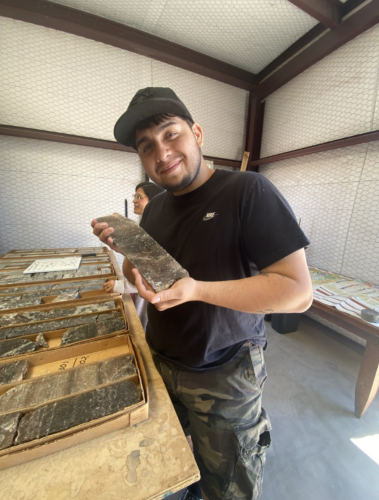
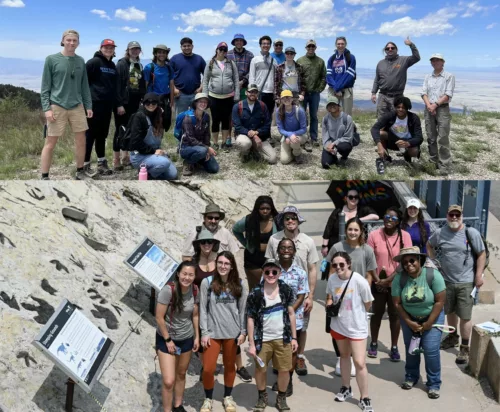
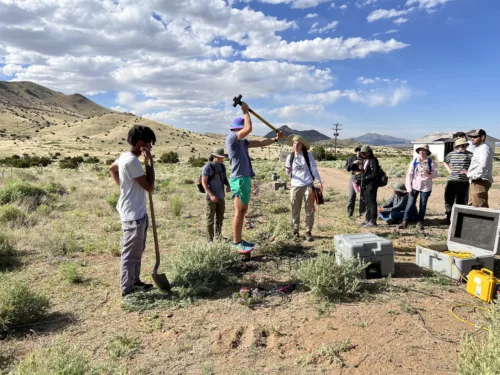
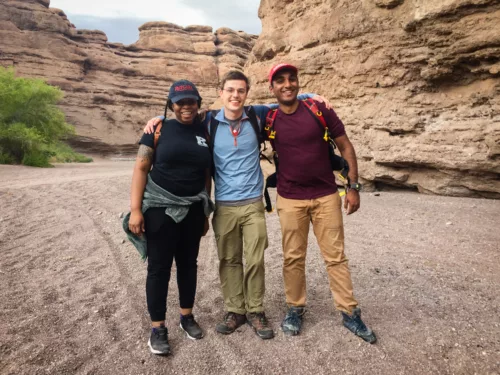
Participating in UCR's field camp last weekend was a success! Heather had four different projects going at once. I helped with the refraction surveys using geophones and nodes. Other groups learned how to install broadband seismometers or took magnetic data near a cinder cone using a magnetometer. The data was successful and we got to see most of it the following day. Other than spending time in the field, we visited many geotourism spots within the Long Valley Caldera. We went to fossil falls (there are no fossils here, false advertising), hiked in Alabama hills and saw where the movie Tremors was staged, visited Hot Creek (saw the new hot spring that just opened up), viewed Convict lake, walked around Mammoth, watched the sunset rise over Mono lake, and scavanged for rocks at an Obsidian dome. We also went to the hot springs located near the field station two nights in a row and saw numerous stars, shooting stars, constellations, and the Milky Way. It was a blast and I am glad to explore more of California! Now, I hope my suitcase doesn't exceed the weight limt flying home with all my new rocks.
References:
Liu, G., Persaud, P., & Clayton, R. W. (2018). Structure of the northern Los Angeles basins revealed in teleseismic receiver functions from short‐term Nodal seismic arrays. Seismological Research Letters, 89 (5), 1680–1689. [url=https://doi.org/10.1785/0220180071]https://doi.org/10.1785/0220180071[/url].
Sui, S., Shen, W., Holt, W., & Kim, J. (2023). Crustal architecture across Southern California and its implications on San Andreas Fault development. Geophysical Research Letters, 50, e2022GL101976. [url=https://doi.org/10.1029/2022GL101976]https://doi.org/10.1029/2022GL101976[/url].
I have a lot to say since my last blog post and I am very happy to express the triumphs of coding receiver functions, creating figures, and enjoying the California sun.
I finished analyzing 24 stations in the CI network in the LABasin! Then I moved on to calculating receiver functions, which was very stressful, nerve-wracking, and worrisome. As I am working on an Apple Mac computer, I witnessed that updates can cause many frustrations. I have learned that many seismologists have occurred a problem with the new Ventura program and we happened to join them. The code I am using is a Fortran code that Ventura does not like (because they are 32 bit, not 64). So Heather nervously recrafted my code and used her expert googling skills to get the code working. Through many attempts, she got the code up and running! Then we created my first receiver function for the station BFS!!! It feels so good to see results! I currently have all the single plots finished for my 24 stations with 1, 2, and 3 Hz.
Then I created a station map. The map posted is of the LABasin and the red triangles are on top of where my stations are located. With help from Grant, we used Matlab to convert the excel file (list of stations with latitudes and longitudes) and geoplot.
The LA basin is prone to earthquakes. Many people know the San Andreas fault is a major fault that runs through CA. But there are numerous faults all over the area! These faults are as significant as the San Andreas. The geologic history of the Pacific plate moving against the North American plate, the spreading center in the California Gulf, and the strike-slip faults, makes this area hazardous. The main issue is that LA rests on a sedimentary basin. This is problematic because sedimentary basins trap seismic energy causing more shaking. Since LA is a highly populated area and has a lot of infrastructure, more shaking can cause drastic effects. The goal of my project is to interpret where this basin layer is and to provide more information about the structure.
Besides researching, I have traveled quite a bit in SoCal. I went to Huntington Gardens in Pasadena, hiking in Malibu, Joshua Tree National Park, Mecca Hills, Indian Canyon and Palm Springs Tramway in Palm Springs, Disneyland in Anaheim, and Laguna Beach. It was amazing watching fireworks over the ocean on the fourth of July! We even saw five different firework shows at one time because we could see that far!
I am enjoying my time here in California. I will admit, I think it is hot here and my shoulders are badly sunburnt from Disneyland and spending the day at the beach, but my coding skills have improved, my geophysics/geology knowledge of CA has grown, and I have grown as an individual. I am very grateful to enjoy all these new experiences with the new people I have met.
Coming up next, I will be analyzing data from a nodal array in the southern part of the LA basin, which will complement my research work so far. Before I start this, I will be heading to UCR's field camp near Convict Lake (with geotourism stops along the way) to participate in a refraction survey using geophones and nodes.
Week 2 has come to an end with the first round of successful data collection and P-wave picking. I am downloading data from IRIS Data Management Center (IRISDMC) and Southern California Earthquake Data Center (SCEDC), specifically using Caltech stations in the LA Basin. I have looked at hundreds, probably more like thousands, of seismographs so far. I am surprised I haven't started dreaming about them. The one trouble I have run into is that many stations are very noisy! Since LA is a highly populated area, this isn't surprising. It does make picking P-waves more difficult, but at times I have come across ideal seismographs. On the side, I am using IRIS Mustang to view the noisiness of stations when data is available. Toward the end of the summer, I will be creating a station map that will mark all the stations I used in my research.
One skill I hope to improve upon is keeping a log that records my research progress. I have never kept track of the work I completed throughout a project or anything in general. I tend to rely on my memorization and prior knowledge to be able to derive what I did in the past, but sometimes I forget what I did. I have started a research journal for this project and I update it every day with an overview of what I did, important things to remember in the future, notes to myself, and other significant details. This skill will be very beneficial in the future and it will be cool to look back and view all the work that I completed.
On the flip side, the weather is starting to get slightly warmer in Riverside. Everyone has forewarned us about the heat, but I have enjoyed the weather in the 70s. I have received a lot of suggestions from the people I have been meeting on campus on places to visit and hikes to go on in California. I'm excited to explore more, try different cuisines, research more, and make the most of my experience!
I am very excited to spend this summer working with Dr. Heather Ford at the University of California Riverside. I will be recreating the structure of the LABasin and mapping the Moho in the area.
Some of my goals for this summer include:
1. Develop new skills in coding and acquire knowledge in geophysics. I do not have a strong background in geophysics and I am looking forward to exploring this field.
2. Improve communication skills with peers, professionals, and non-professionals regarding teaching concepts and discussing scientific information.
3, Determine my future. I am undecided as to whether or not I want to attend graduate school and which field of study within geology is the best fit for me. I am hoping URISE will help my decision.
I have started picking seismograms from the numerous stations in the LABasin. It is very tedious work going back 15 years and looking at all the seismograms, but I am enjoying it! I also love the office space I get to work in with other graduate students. My next step will be to pick P-waves, in preparation for running the code for Ps-receiver functions.
As for exploring Riverside, I hope to do some touristy things and go on some hikes with new people I meet. Someone has already offered to take me to my first In-n-Out, as we do not have those in Northern New York. I can't wait to progress personally and professionally throughout the summer while enjoying California!