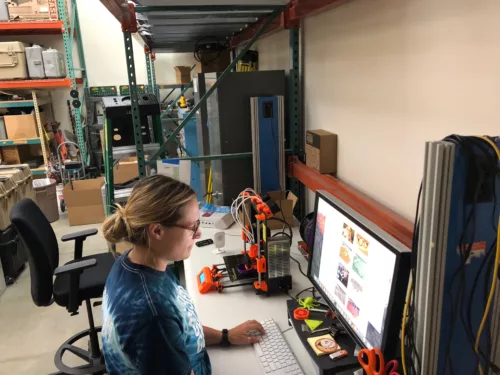
Elliz McClelland is a student at Michigan Tech currently completing research at USGS under Paul Bedrosian.
I am working with Paul Bedrosian at USGS to collect and process magnetotelluric data collected at Valles Caldera, New Mexico. The goal of my project is to construct a 3D resistivity model to better shape our understanding of the Valles Caldera structure and magmatic system. I will also be assisting Paul in MT data acquisition in Hawaii for USGS studies on Kilauea. The Valles Caldera data I am processing was collected by the Summer of Applied Geophysical Experience (SAGE) program.
This is my last day working at the USGS office in Denver--but my internship isn't quite done yet. Because of how busy this summer has been, we're only just now getting some preliminary results on the Valles Caldera. Therefore I'll be continuing to work on this project after I return to Michigan. I'm excited to return home but looking forward to exploring and interpreting the models we can create with our magnetotelluric data.
This summer has been a wonderful experience for me. I tried new things that I would never have imagined. I lived in the heart of a big city. I skydived over Colorado. I explored Hawaiʻi and even stood within the craters of Kīlauea. And possibly most importantly, I developed strong friendships with some of the people I've met. I've developed so much more confidence in myself and my abilities. When I first set my goal to become comfortable living in Denver at the beginning of this summer, I never could have imagined what I would end up accomplishing.
I've also learned so much about what it means to work for USGS, and what a USGS researcher's workload looks like. This internship has confirmed to me that I would enjoy working for USGS or a similar agency--although it's also given me an insight into the not so pleasant bureaucracy of working for the federal government. This internship has confirmed to me that I am going in the right direction for my career interests.
When I first started this internship, I had never heard of magnetotellurics. And, while I'm certainly no expert, now I have a strong working knowledge of the method. It's exciting to have another geophysical technique to add to my repertoire. Now that we're mving into the interpretation stage of the Valles Caldera project, I will get to fully flesh out how magnetotelluric data is applied to things like magma bodies. All in all, this has been a really good internship experience. I'm really happy with what I did this summer and what I learned.
I've taken a break from processing my Valles Caldera data to join my mentor in Hawaiʻi doing geophysical field work! We're working to install over 50 magnetotelluric stations along the southeastern coast of Hawaiʻi (the Big Island). This is part of an ongoing USGS study on Kīlauea in order to image the mantle structure beneath Hawaiʻi.
So far it's been a lot of fun! Most of our sites are only acessible by helicopter, so I have gotten to spend a lot of time flying around. Before this I had never been to Hawaii and never been in a helicopter. This trip has been a lot of hard work and we've been working practically non-stop. I have gotten to go snorkeling in the Pacific ocean and have taken a nap on a lava flow (several naps, actually).
Some Hawaiian words I have learned so far!
Mahalo -- Thank You
Pāhoehoe [Pa-hoy-hoy] -- Smooth, ropy type lava flows (low viscosity basalt)
ʻAʻā [Ah-Ah] -- sharp, rubbly lava (higher viscosity basalt)
Lilikoi [Lily-coy] -- Passion fruit. A very popular flavor--shaved ice, butter, desserts!
Kīpuka -- a section of land surrounded by younger lava flows. Many of our MT sites are located on these so that we can bury our equipment better than in the pāhoehoe.
Soursop -- A common Hawaiian fruit that tastes a bit like pear and pineapple--delicious!
Some Pictures I've Taken!
Hawaiian Coastline taken from our helicopter.
Ready in my flight suit shortly before my first ever helicopter ride!
Looking out over the ocean from one of our sites on pāhoehoe lava.
A (blurry) map of where we are in Hawaiʻi
When it comes to large “super-volcano” calderas like the Valles and Yellowstone, possibly the most important question people ask is “Will it erupt again?”. After all, the magnitude of the eruptions which created these calderas would have devastating impacts on human civilization if they were to occur at present day. To answer this question, scientists seek to understand what the magma system which created the caldera looks like, both in the past and in present day. There are a variety of ways to approach this, from both inside the lab and out in the field.
One way scientists try to gain knowledge about if a caldera has an active magma body is by looking for indicators like earthquakes (seismicity) and geothermal activity. Magma close to the surface can generate a variety of earthquakes as well as hot springs, fumaroles, and geysers as the magma heats up the surrounding rock. Yellowstone, for instance, has a large number of very hot and very active geothermal features, indicating a large influx of subsurface heat. The Valles Caldera, however, has only a few surface geothermal expressions. Geothermal activity in the Valles is limited to quiet, diffusive fumaroles and several hot springs. Interestingly, the Valles caldera is also relatively aseismic, meaning it has very little natural earthquake activity.
Does that mean there’s no (or very little) magma near the surface at the Valles? Not necessarily! The lack of natural seismicity at the Valles could actually be an indication of a large source of heat underneath the caldera. Earthquakes happen when pressure in the rocks is relieved through brittle fracturing, where the rock fractures or moves along an already fractured fault. But if a rock is warm enough (~250-400 °C), it will instead relieve pressure through ductile deformation. Ductile deformation does not induce seismicity in the way that brittle fracture does. So the Valles Caldera may be naturally aseismic due to relatively high subsurface temperatures preventing brittle failure. It is also possible that stress is being relieved along the active faults adjacent to the Valles Caldera associated with the Rio Grande Rift (Nettleton, 1997). This would prevent enough stress from building up within the caldera to create earthquakes.
So…observing natural seismicity and surface geothermal activity in the Valles Caldera is inconclusive. What about more data-based geophysical studies like gravity, heat flow, and seismic tomography? Geophysicists have collected a wide variety of geophysical data on the Valles Caldera in the hopes of gaining a better idea of the subsurface and potential magma bodies.
It is typically difficult to get accurate results on the amount of heat in the subsurface because it is necessary to drill deep boreholes, which is expensive and labor-intensive. Luckily for us, the Valles Caldera was subject to extensive industrial geothermal exploration in the late 1900s by Unocal (Union Oil Company). The company originally planned on building a power plant in the Valles, and even got as far as laying down concrete foundation, but abandoned the site in 1982 when it proved not to be economically viable. Unocal drilled over 38 wells, and while every well had significant heat output, only a couple had enough water and permeable rock to be viable for economic production. While the Valles Caldera was ill-suited for commercial geothermal activity, today scientists benefit from the data Unocal has collected. *In fact, Unocal also collected magnetotelluric data available to us, but the more primitive equipment used and lack of metadata means we’ve chosen not to use it for this study.*
This picture is a map of the test wells drilled by Unocal and surface geothermal features in the Valles. As you can see, the distribution is very asymmetrical, with sites concentrated in the western portion of the caldera. Unocal recorded temperatures over 300 °C less than three kilometers deep. They estimated the average heat flow of the region to be around 4 HFU (heat flow units). The surrounding Rio Grande Rift has an average of 2.8 HFU. The thermal gradient of the region was also inferred from the geothermal well data. The region of highest heat is below San Antonio Mountain, which is along the western edge of the caldera. These geothermal results indicate that the Valles Caldera has an abnormally high heat anomaly with respect to the rest of the Rio Grande Rift. This heat could be from hot magma at depth, or residual heat from the emplacement of the rhyolitic domes 130,000 years ago.
Geothermal surface features and Unocal test wells. Black dots are test wells, open dots with lines are surface geothermal features (hot springs, fumeroles, etc.)
Measuring the change in gravity at a location can give geophysicists a better indication of the overall structure of the subsurface. In a nutshell, this is because the Earth’s gravity changes ever so slightly depending on the density of the rock beneath us. Geophysicists measure the change in gravity and use forward modeling to create profiles of the lithologic structure. Obtaining gravity profiles on the Valles caldera is important for understanding the larger structure, but can also be used to guide other geophysical research. Because all geophysical data requires knowledge of the expected geology to interpret, the information determined from gravity profiles can be correlated with the data obtained in seismic or magnetotelluric studies to make interpretations more accurate.
Several gravity surveys have been performed on the Valles, the first conducted by Segar in 1974. While the exact depths vary from survey to survey, all studies agree that the Precambrian basement beneath the caldera is shallow in the west, and deepens toward the east. The volcanic rocks which fill the caldera are estimated to be less than 1000 feet thick in the west, and possibly more that 3,000 feet thick in the west.
Seismic results directly complement magnetotelluric studies, because seismic and magnetotelluric techniques are sensitive to similar rock properties. As such, this section of the blog post is more extensive and detailed. A summary of the seismic results will be at the end of this section.
In 1986, Ankeny et al used novel seismic ray tracing techniques to create a 3D model of the crust in the Rio Grande region. This seismic technique uses the first arrival of seismic waves (P-waves) created from earthquakes and active sources. The travel times of the seismic waves were used to model wave velocities of the subsurface. The change in seismic velocity indicates important changes in lithology, such as type of rock, temperature, and other effects. Ankeny et al. modeled a cylindrical zone of low velocity below the Vales Caldera, centered beneath the same area where surface geothermal activity occurs (see picture). They proposed this low velocity zone was a result of very high temperatures in this region, caused by an encroaching magma body (Nettleton, 1997).
Seismic velocity profile created by Ankeny et al. Note the deep 5.60 km/s anomaly underneath the southern Valles Caldera.
In 1991, Roberts et al. conducted a passive seismic experiment and created 2D models of the subsurface using forward modeling of the observed seismic velocity delays. Roberts observed a very strong delay in the seismic arrival times, indicating a zone of very low seismic velocity in the subsurface. Their 2D models indicated a low velocity zone approximately 10 kilometers deep and 19 kilometers wide (see picture). Roberts et al. suggest this low velocity zone is a zone of partial melt—aka a magma body. However, it is possible it is residual magma cooling after the last eruption, or a new magma body developing.
Seismic profile by Roberts et al. Notice the 3.7 km/s seismic velocity anomaly centered 10 kilometers deep
The Jemez Tomography Experiment (JTEX) conducted both passive and active seismic experiments which complement Roberts et al work. JTEX modeled three seismic anomalies beneath the Valles caldera. The shallowest anomaly, imaged underneath the western San Antonio Mountain, terminates only 5 kilometers deep and is coincident with the region of highest geothermal activity. This anomaly is likely due to the high geothermal temperatures. JTEX also imaged a low velocity zone at approximately the same depth as Roberts et al. This low velocity zone appears 10 kilometers deep but is much smaller than Roberts model. Interestingly, JTEX also imaged a low velocity anomaly 35 kilometers deep. Based on regional geophysical and petrological modeling, this anomaly is likely the brittle-ductile transition, where the crust becomes hot enough it deforms instead of fracturing.
Most recently, Wilgus et al. used ambient wave tomography to produce a shear wave velocity image of the Valles Caldera (published in 2023). This newer technique is more sensitive to possible magma bodies and has improved resolution (clarity) at depth. They imaged a prominent low velocity anomaly directly below Redondo Peak. This anomaly indicates a significant (32%) decrease in seismic velocity, and is about 7 kilometers thick and 6 kilometers wide. The top of the anomaly appears 3 kilometers deep. This anomaly is indicative of a magma body. Wilgus et al. believe the anomaly is indicative of an active, potentially growing magmatic system. The velocity structure below the Valles is comparable to that of similar, active volcanic fields.
In short, every seismic study indicates a zone of unusually low velocity in the Valles subsurface, typically near or underneath Redondo Peak. This low velocity zone is indicative of some kind of magma body, although whether it is a cooling or growing body is uncertain. The size and depth of the anomaly is variable, ranging from 3-10 kilometers deep and 6 to even 19 kilometers wide. Interestingly, the JTEX study also imaged the brittle-ductile transition, a flat change in seismic velocity 35 kilometers deep.
A few prior magnetotelluric studies have been conducted, with the hopes of supporting the seismic results. In 1996, Jiracek et al. used Unocal and SAGE (Summer of Applied Geophysical Experience) magnetotelluric data to create a 2D model. Jiracek et al. did not observe an anomaly that corresponds with the low velocity anomaly in the seismic results. They did observe a deep conductor, which likely represents the brittle-ductile transition.
If Jiracek et al. didn’t observe the anomaly seen in the seismic studies, does that mean it isn’t there? Following the 1991 study, Jiracek performed forward modeling using the model created by the seismic studies—modeling the expected magnetotelluric data if that were the subsurface. Crucially, Jiracek discovered that the magnetotelluric method is not sensitive enough to a conductive body that small. In magnetotellurics, in order for a conductive body to be apparent in the data, it has to be significantly larger or more conductive than the material above it. Jiracek determined that if the body were larger, magnetotelluric data would observe it. But the actual anomaly may be too small to be recorded.
So why keep trying magnetotellurics, if it’s not sensitive enough? Well, the magnetotelluric technique is very young, and equipment, interpretation, and modeling techniques are constantly evolving. With more modern equipment and new modeling algorithms, it is possible geophysicists might be able to overcome the challenges that Jiracek faced.
In 1997, Nettleton produced a 2D model of the Valles by building upon Jiracek’s techniques. Nettleton used newer 2D inversion techniques to create his model, but produced very similar results as Jiracek et al. Nettleton did not observe an anomaly correlated with the seismic results. He did observe a deep, broad conductive anomaly. He interpreted this as the brittle-ductile transition, with an accumulation of trapped saline brine.
Most recently, Feucht performed both 2D and 3D inversion of magnetotelluric data from the Valles Caldera. They used the same data used by Nettleton, as well as additional SAGE data collected since Nettleton’s study. Curiously, Feucht was able to image an appropriately sized conductive anomaly at the depth noted in the seismic studies. However, this anomaly appeared only in the 2D model. In the 3D model, the only anomaly was the same conductive brittle-ductile boundary imaged by Nettleton and Jiracek et al.
Feucht's 2D model. The conductive anomaly (LRZ) is apparent at approximately 10 kilometers deep. The mid-crustal conductor is beneath it, marked with the black dashed line. This conductor is assumed to be the brittle-ductile boundary.
Feucht’s study forms the basis of my work in the Valles Caldera. Why did the conductive anomaly we’re searching for only appear in 2D? Using newer data and inversion techniques, can we image this anomaly? Feucht’s reasoning for the absence of the conductive anomaly in the 3D inversion was due to the magnetic tipper. The magnetic tipper is the vertical component of the magnetic field, and using the tipper in magnetotelluric interpretation is a relatively new concept. For the 2D model, Feucht used an inversion algorithm which accounted for the effects of the tipper. The 3D model did not use or account for the tipper in any way. This suggests that the magnetic tipper has a more important role in the inversion modeling process than previously realized.
In my 3D model, I am aiming to resolve the uncertainties that prior magnetotelluric work, particularly Feucht, has identified. The previous studies have used primarily the same data set, the bulk of which was collected in the 70s and 80s by Unocal. A lot of this data was collected on now primitive equipment, and crucial metadata has been lost to time. In my study, we have added 27 new data sites, collected by SAGE in recent years with modern equipment. 16 of those sites I helped collect! We’ve removed the Unocal and older SAGE data that Nettleton used, since we now have newer, cleaner data available. And importantly, our 3D inversion algorithm will account for the magnetic tipper, which Feucht was unable to do. With new data and a more robust modeling algorithm, we are hoping to resolve the presence of the anomaly located by the seismic data, and determine if an active magma body truly does lie beneath the Valles Caldera.
Feucht, D. W. (2017). Magnetotelluric imaging of lithospheric modification in the Rio Grande Rift, Colorado and New Mexico, USA. PhDT. [url=https://ui.adsabs.harvard.edu/abs/2017PhDT]https://ui.adsabs.harvard.edu/abs/2017PhDT[/url]. . .. . ..122F/abstract
Nettleton, C. (1997). Magnetotelluric Modelling of the Valles Caldera, New Mexico [MA Thesis]. San Diego University.
Wilgus, J., Schmandt, B., Maguire, R., Jiang, C., & Chaput, J. (2023). Shear velocity evidence of upper crustal magma storage beneath Valles Caldera. Geophysical Research Letters, 50, e2022GL101520. [url=https://doi]https://doi[/url]. org/10.1029/2022GL101520
For a refresher on the principles of MT, visit my blog post “The Basics of the Magnetotelluric Method”.
In the field, MT data is collected using 3 to 5 electrodes, 3 magnetometers, a data logger, and a lot of wires. The electrodes measure the electrical field along the North-South and East-West axes, and the magnetometers measure the magnetic field along the North-South, East-West, and vertical axes.
The electrodes are a special kind of electrode called a “non-polarizable electrode”. Unlike regular metal electrodes, these electrodes are not affected by the current passing through them and do not produce any charge that might interfere with the data. These electrodes are composed of a wire or rod surrounded by a chemical solution within the plastic electrode body. At the end of the electrode is a porous (ceramic) cap which allows electrical ions to enter. These ions cause an electrochemical reaction between the rod and surrounding liquid, generating the charge that is recorded by the data logger. Non-polarizable electrodes commonly contain silver within silver chloride (used in our survey), or copper in copper sulphate.
To increase the surface area of the electrode in contact with the soil, we encased the ceramic end of our electrodes in the Valles Caldera with a Bentonite clay ball. Bentonite clay is easy to manipulate and highly conductive, increasing the electrode’s contact with the ground. The electrode and clay were wrapped in a porous canvas bag to keep them together.
This is a picture of my mentor Paul burying an electrode. The electrode is in a white bag, with the round ball of Bentonite clay at one end. Coming out of the other end of the electrode is a wire, which transmits the charge to the data logger. In the Valles, we also attached paracord handles (blue) to the electrodes to make them easier to pull up when we were done. These electrodes are buried about a foot deep and are placed horizontal to prevent temperature variation.
As you can see in the diagram at the top of the page, the electrodes are buried in a plus configuration aligned with north-south and east-west. At the center of the plus is the data logger as well as a central electrode (not marked in the figure). In the Valles Caldera, we set up most sites with an altered configuration of an L instead of a plus. In the plus configuration, one electrode is buried due north and the other due east. The central electrode in this case acts as both the south and west electrode. The exact configuration of MT sites depends a lot on the type of datalogger used. In the Valles Caldera, we used two different systems which measure in two different ways. For some data loggers, the central electrode acts as the ground, while others do not use a ground. The L configuration worked well for our dataloggers because they measure potential between each electrode and the central ground electrode, instead of the potential across each set of electrode directly.
Although the diagram above notes that each electrode is 50 meters away from the data logger, this does not have to be the case. Any distance above 30 meters will work, although geophysicist commonly use 50 meters as an easy number to work with. What is important is that the distance between each electrode and the logger is recorded so that it can be used during electrical potential calculations.
The magnetometers used for MT are induction coils, which are long pieces of tubing containing a metal rod wrapped in a tightly wound copper coil. As the magnetic field passes through the coil, an electrical current is induced (Faraday’s law). A wire connecting the coil to the datalogger transmits this electrical signal to be recorded. At MT sites, three coils are used in order to measure the magnetic field in three directions.
As seen in the top figure, each coil is buried oriented in a specific direction. The coil measuring the North-South magnetic field is buried oriented due magnetic North. Correspondingly, the coil measuring the East-West magnetic field is buried oriented due East. The third coil is buried perfectly vertical in order to measure the vertical field. Compasses and levels are used in the field to make sure each magnetometer (coil) is placed as perfectly as possible. A coil which is not level or not oriented correctly will pick up magnetic signal components that are not perfectly horizontal or vertical—bad data. The horizontal coils are buried approximately 6-8 inches deep, and the vertical coil is buried completely (or as close as possible). These are pictures of some of the magnetometers we used in the Valles Caldera. One is a horizontal coil, and the other vertical.
The most important piece of an MT site is the datalogger, which records and saves all of the data recorded. This equipment sits at the center of the site and is typically buried, placed in a bag or box, or receives some other manner of protection from the environment. This is a picture of one of our dataloggers in the Valles all hooked up. This particular logger is a Phoenix Geophysics MTU-5C. The electrodes are connected at the top with the red, brown, and yellow wires. The three magnetometer coils are connected at the bottom (bright blue plugs). A lithium battery and GPS are also connected to supply power and precise time measurements. The data is recorded onto an SD card, located under the plate on the left side. This SD card also contains the configuration file that commands the datalogger. This is a picture of my mentor leisurely reconfiguring the SD card for our datalogger at a Valles Caldera site.
At the Valles we also had the ZEN datalogger, which I was significantly less fond of installing. This datalogger works in a very similar way to the Phoenix logger, but has less intuitive cable connections and an internal GPS. Here is a picture of Paul opening up the internal hardware of a ZEN in the field in order to troubleshoot a problem.
Magnetotelluric sites are left to record for long periods of time before they are dug up and repacked for a future site. At the Valles Caldera, we allowed most sites to run for 1 to 2 days. Some surveys may run sites for much longer in order to pick up longer period signals. This makes MT field work feel a bit like leapfrog—constantly picking up sites to put down new ones.
I would say that what I've done in this internship so far that I am most proud of is...this blog! I'm really enjoying using this blog as a medium to both educate other people and reinforce my own learning. I really enjoy writing and science communication and some of my favorite work is to write up new blog posts. Distilling my internship's scientific concepts into easy to read posts is also helping me a lot to understand what I'm learning about.
I'm also proud of my success with ArcGIS Pro and the map I created (see my blog post "Where Is My Data?"). ArcGIS Pro is the only software I'm working with in this internship that I am already familiar with, and it is nice to have something familiar to work on. It's always satisfying to see a beautiful map when you're done.
This internship has had a lot of challenges so far. My biggest challenge has been software issues! I have been relying on two types of programs to view, process, and analyze my data. Unfortunately, neither one has been working consistently enough to use. One program has been entirely unusable due to issues with USGS IT. The other, a series of Python notebooks written by my co-mentor, has been at best, barely working. I do not have a good understanding of Python, particularily the technical side required to troubleshoot file errors. Even when I can get the Python commands to run my data, a majority of the functions have not been working. I just downloaded a new program which appears to be working, so I have hope I can begin consistently reviewing my data! It comes with it's own issues, however, so not a perfect fix.
All in all I'm looking forward to posting more about the data I'm reviewing, and hoping my softwares cooperates!
Here are my sites! The green triangles are data sites collected by me and Yair Franco at the beginning of June this year. The other data points are sites collected by SAGE in previous years. As you can see, a majority of the data was collected this year. We have reasonably good spatial coverage of the inside of the caldera--this means our data points are distributed relatively evenly. In the future, more data sites could be placed on Redondo Peak and Cerro del Medio to increase resolution. One important data location we are mssing is data on the exterior rim of the caldera. There are very few sites located outside of the caldera margins--only three 2023 sites and one 2017 site. This means we will not have good, if any, resolution on the structure of the caldera rim.
The (simplified) geology of the Valles Caldera is also on this map. For a full geologic history and explanation of this region, visit my blog post "What is the Valles Caldera?". In brief, the caldera is the large circular depression which disrupts prior lithologic units like the Tschicoma Formation and Toldeo rhyolites. The orange and red mountains are rhyolite domes which erupted after the caldera collapsed. Redondo Peak, which is covered in Bandelier Tuff, is a resurgent dome near the center of the caldera. Much of the rest of the caldera is filled with alluvium, debris flow sediments, and smaller volcanic flows.
We are studying this region in order to identify possible magmatic bodies beneath the subsurface, which will appear as conductive regions in the magnetotelluric data. This caldera is similar in formation to Yellowstone--which has been extensively studied using magnetotellurics to determine locations of magma activity. However, unlike Yellowstone, the Valles Caldera is seismically quiet and has only a few geothermal features. This magnetotelluric study will hopefully allow us to develop more of an understanding as to why the Valles is so different from Yellowstone.
This map was created in ArcGIS Pro using GIS layers from the USGS and New Mexico Bureau of Geology & Mineral Resources.
Magnetotellurics (MT) is a passive electromagnetic technique that allows geophysicists to gain data up to hundreds of kilometers deep in the Earth. Essentially, MT measures the natural variations of the Earth’s electromagnetic field in response to the Earth’s subsurface. (Earth's magnetic field: Explained | Space).
To understand electromagnetic measurements, some basic background information is required. Changing magnetic and electric fields are linked. When either type of field is changed or created, the other type is also generated. They travel in the form of sinusoidal waves, referred to as electromagnetic waves. The electric and magnetic field travel in the same direction, but are oriented at 90 degrees from another. The Earth has a natural magnetic field created by convection currents in the outer core, which generates electromagnetic currents as it interacts with solar wind and the Earth’s ionosphere. This source of electromagnetic energy is lower frequency, typically less than 1 Hertz. Electromagnetic currents are also generated by a variety of sources including lightning and man-made machinery. These sources are higher frequency. Geophysicists aim to avoid human-generated electromagnetic fields as much as possible, because they introduce noise into the data. Because of the prevalence of electronics around the globe, however, incoherent noise at 60 Hz is recorded in virtually all MT data. Magnetotellurics focuses on the frequency (how many times the wave repeats per second) and phase (the angle between two signals) of electromagnetic waves.
(diagram of electromagnetic wave)
As electromagnetic waves strike the surface of the Earth, most of the energy is reflected back upwards. Some of the electromagnetic current, however, enters the Earth and diffuses downwards. As the electromagnetic current passes through materials with different resistivities (a material’s resistance to allowing electric current flow), the properties of the electromagnetic field changes. By measuring these electromagnetic fields, geophysicists can determine how the resistivity of the Earth varies with depth. It’s important to note that magnetotelluric data determines the apparent resistivity of the subsurface, not the actual resistivity. Apparent resistivity is a volumetric, non-unique measurement. That is, layers with differing geometry and actual resistivity can produce the same apparent resistivity. To solve this, geophysicists create models of the subsurface that match the magnetotelluric response recorded. This technique is called forward modeling, and prior knowledge of the survey geology is required in order to confirm accuracy.
Why do we care about resistivity? Different types of materials within the Earth have different resistivities. Even the physical structure and water content of a material can affect it’s resistivity. For instance, solid and unweathered igneous and metamorphic rocks have some of the highest resistivity, while loose sediment has very low resistivity. The more weathered or broken up a material is, the lower the resistivity typically is. In addition, higher water contents decrease resistivity. Geophysicists compare typical resistivity values for geologic materials to the subsurface resistivity distribution created by their models. In combination with the anticipated geology of the survey region, geophysicists can gain an understanding of the distribution of different geologic materials within the subsurface.
(resistivity/conductivity chart of common geologic materials)
Magnetotelluric data is first measured as a time series, where the electromagnetic field is changing over time. In order to determine the apparent resistivity at varying depths, the data must be measured as it changes over frequency. This is because different frequencies of electromagnetic energy reach different depths of the Earth. The higher the frequency, the faster the energy dissipates, or the shallower the wave reaches. Low frequencies take longer to dissipate (attenuate), and reach much deeper depths within the Earth. If the magnetotelluric data is viewed as a change in field over frequency, an estimation of apparent resistivity over depth can be made.
MT data is converted from time series to frequency domain using the Fourier transform function. The Fourier transform is a series of complicated math which converts periodic signal into a form which describes the frequencies occurring in the original data. A way I like to think of it is that if your data is plotted in a coordinate plane, where y is your signal and x is time, the Fourier transform will convert your plot into a new plot where x is the frequency of your signal, and y is the amount of times signal occurred at that frequency. The math behind this function, as well as it’s actual output in MT data, is a lot more complicated.
(example of signal in the time domain [blue] passed through a Fourier transform into frequency domain [red])
The apparent resistivity of magnetotelluric data is determined from the complex impedance tensor of the electromagnetic field. This is a set of vectors with an imaginary and a real component. Impedance is a measure of all factors which obstruct or prevent electric flow in a material—providing a measure of apparent resistivity.
The simplified math behind it--to my current understanding--is such:
The magnetic field in the direction of East-West (Hy) is equal to the electrical field in the direction of North-South (Ex) multiplied by the imepdance vector Zxy. Therefore, given the ratio of Ex/Hy as measured from the magnetotelluric data, geophysicists can estimate Zxy. The same is true in the opposite directions (Ey/Hx = Zyx). Apparent resistivity is proportional to the magnitude of the impedance vector.
The phase of the electromagnetic waves is also plotted against frequency, using the Fourier transform function. The difference between the electric and magnetic phases (referred to as lag) provides information about whether the ground is becoming more or less resistant with depth or lateral distance. In an isotropic, homogenous Earth, the electrical field leads the magnetic field by 45 degrees. If a farther layer is more conductive, the phase will be above 45 degrees, and vice versa.The phase is also represented by the phase tensor, which indicates preferred direction of current flow in the subsurface.
Graphically, both the impendance tensor and the phase tensor can be mapped to provide valuable spatial information. When the real vector component of the impedance tensor is mapped, the vector (arrow) points in the direction of subsurface conductors. The phase tensor is plotted as an ellipsis indicating preferential direction of flow. When it is a circle, current flows equally in all directions in the subsurface. I’m hoping to provide an example of these graphical representations from my own data in a future blog post.
Another component of magnetotelluric data which can be useful during graphical interpretation is the tipper. The tipper is the ratio of the vertical magnetic field over the horizontal magnetic field. The Earth's natural magnetic field has no vertical magnetic component--the vertical component measured by magnetotelluric magnetometers is created entirely by the effects of subsurface structure. The tipper provides a representation of how much vertical field is induced. If the magnetic field is entirely horizontal (i.e. homogenous Earth), the tipper is zero. The components of the tipper can be plotted as a vector graphically. When plotted, the tipper vector (arrow) points in the direction of regions of higher conductivity. Plotting the tipper is a simple way to get a qualitative assessment of subsurface regions of conductivity.
MT data can be analyzed from the perspective of a 1D, 2D, or 3D earth. With each added dimension, the processing and inversion techniques become more complicated, but more complex subsurface geometries can be analyzed. In a 1D earth analysis, the subsurface is assumed to be composed of a series of flat homogenous layers where resistivity varies on only one direction—depth. This is the simplest possible model, and is only realistic in limited geologic situations like simple sedimentary basins. A simple model of potential thicknesses of each layer can be determined at any single magnetotelluric station using forward modeling. These model solutions are non-unique and may not be able to be accurately determined.
In a 2D earth assumption, resistivity is assumed to vary with depth and in the lateral x direction. The change in x direction can be most simply represented by a geologic fault, dyke, or other abrupt change in lithology. The length of such discontinuity must be much greater than the penetration depth of the electromagnetic field. To analyze 2D MT data, the data is decomposed into two components, where the electric field is parallel to the strike (TE) and the magnetic field is parallel to strike (TM). The TE and TM notation is the same as the xy and yx notation seen above. This type of MT analysis is typically conducted along profiles, or lines of data stations which cross over the expected discontinuity.
3D earth analysis is the most complicated but provides the most accurate representation of complicated geologic structures, such as the lenses of magma bodies at the Valles Caldera. In this model assumption, resistivity varies in all three directions (say, down, east-west, and north-south). For these models, the full impedance tensor is calculated and can be used to model the subsurface across a broad area.
In short, magnetotellurics is complicated! I’m still working on developing my understanding of how these principles work and how to apply them to the data collected for the Valles Caldera.
The Valles Caldera is a large, crater-like depression formed during a "supervolcano" eruption approximately 1.25 million years ago. It is one of the largest young calderas on Earth, located in northern New Mexico. Resurgent volcanic domes, volcanic flows, and geothermal features are prevalent within the caldera. Today, the caldera is within the Valles Caldera National Preserve, which protects the caldera features and native wildlife from human impact.
What is a supervolcano?
The Valles Caldera is an example of a supervolcanic system, just like Yellowstone. A supervolcano is an extremely large volcano which has had a volcanic eruption of catastrophic magnitude (VEI 8). The eruption which created the Valles Caldera erupted over 400 cubic kilometers of pyroclastic materials and created the 13.7 mile wide caldera floor. For reference, Mount St. Helens erupted 0.15 cubic kilometers of material during the 1980 eruption.
What is a caldera?
Volcanic calderas form when a large eruption removes enough magma from the volcano’s magma chamber that the overlying rock is no longer supported, causing the volcanic center to collapse and form a crater-like depression. The walls of the caldera where the rock faulted is referred to as a ring fractures, and are concentric around the center of the caldera.
In the hundreds of years following eruption and caldera collapse, the center of the caldera floor typically rises, forming resurgent domes. These domes are due to the uplift of the faulted caldera floor as the naturally buoyant magma underneath begins to rise.
As the magma chamber underlying the caldera rises, new eruptions occur. These eruptions typically occur at the ring fractures of the caldera, where previously faulted rock provides an easy way for magma to reach the surface.
The regions of the caldera which did not experience resurgence or new volcanic flows typically form flat, broad lakes due to their low lying profile in relation to the surrounding geologic structures. At present day, most of these lakes have evaporated, leaving fertile valleys and plains perfect for diverse wildlife.
Where are these features in the Valles Caldera?
The second picture is an elevation map of the Valles Caldera, with higher elevations noted in warm colors such as yellow and red. Geologic features and points of interest are labeled. The dotted white circle indicates the rim of the Valles Caldera, as well as the Toledo Caldera, an older eruption partially covered by the Valles eruption. The large red mountain near the center of the Valles Caldera is Redondo Peak, a large resurgent dome. This dome is the largest in the caldera, at an elevation of 11,258 ft.
The smaller domes within the caldera which form a near circle around the resurgent dome are erupted volcanic flows. These rhyolitic flows erupted along the Valles Caldera ring fractures. In this caldera, the ring fractures erupted in a mostly counter clockwise direction, beginning with the domes northeast of the Redondo Peak (Cerro del Medio) and ending just south of Redondo. The youngest ring fracture eruption is the Banco Bonito flow, which erupted approximately 50,000 years ago.
The Valle Grande is the largest valley within the Valles Caldera, although it is not the only one. The Valle Grande and other flat regions are what remains of the original unaltered caldera floor. These plains filled with water during the Pleistocene, creating large broad lakes.
What rocks are in the Valles Caldera?
When the large eruption 1.25 million years ago created the caldera, it erupted hundreds of cubic kilometers of tephra and ash material. This material settled onto the ground and lithified, creating the Bandelier Tuff. This tuff layer is up to several hundreds of meters thick in the caldera. At present day, the Bandelier Tuff is exposed on Redondo Peak, where the resurgent dome pushed up the material without disturbing it. It is also buried underneath the Valle Grande and other flat regions.
The ring fracture eruptions which surround Redondo Peak are composed of rhyolite and dacite, intermediate to silicic rocks which were extremely thick and viscous during eruption. These eruptions also contained a large amount of obsidian, or volcanic glass. The ring fracture domes retain their rounded dome structure and shape due to the high viscosity of rhyolite lava. The Native Americans who lived in this region used the obsidian from these eruptions to create sharp weapons and tools. At present day, obsidian chunks of all sizes can be observed all around the ring fracture domes, including obsidian boulders.
In flat regions like the Valle Grande, the Bandelier tuff has been covered by thick lacustrine clays and sand. These sediments were deposited by the Pleistocene lakes which filled in these valleys.
Water heated by the underlying magma system has also created hydrothermal features throughout the caldera, particularly along the west margin of the caldera. In these regions, hydrothermally altered rock, large quantities of sulfur, and fumaroles and hot springs diffusing gas and water can be observed.
Why did the Valles Caldera erupt?
The Valles Caldera is located at the intersection of the Jemez volcanic lineaments and the Rio Grande rift. These are tectonic features where the Earth’s crust is being pulled apart, or extended. The combination of these intense tectonic pressures in two different directions weakened the crust in this region, allowing extensive amounts of magma to collect. The Valles Caldera is part of the Jemez Volcanic field, which has began erupting 16.5 million years ago. A large system of complex lenses of magma were built and erupted throughout the history of this volcanic field, including the large eruption which created the Valles Caldera.
The bulk of my data was collected by myself and my mentor in association with the Summer of Applied Geophysical Experience (SAGE) program. You can read my previous blog post to hear about that experience!. A smaller set of the data I am working with was collected by SAGE in recent years. If time and resources permit I may also be able to work with MT and geothermal well data obtained prior to the National Park Service's aquisition of the property. Most of the data I am working with has already been processed into the Fourier components used to determine apparent resistivity. We are still analyzing the quality of the data collected earlier this month, so that data has yet to be fully processed for me to work with.
I was asked to reflect on a research skill I am working to develop over this summer. The skill I am most weak at is figuring out the next step in a research project. I have the skills to independently research on projects I have experience with, but magnetotellurics is very new to me. Self-guided research is a very important skill to develop in order to further my personal goals. Graduate school and any geophysical career requires the ability to function and research independently. I am working on this skill during this summer by gaining practice working on my own and setting my own tasks. With guidance from my experienced mentors, I can develop a better understanding of the steps for magnetotelluric research.
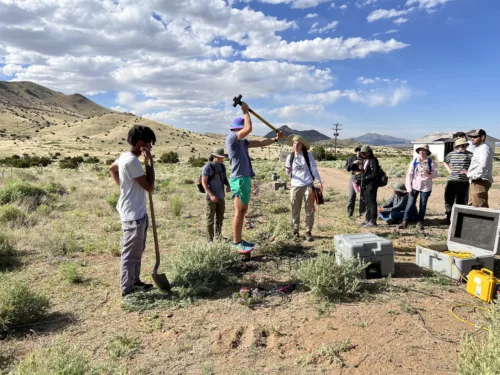
I started out my internship by jumping right into field work at the Valles Caldera, New Mexico! In collaboration with USGS, PASSCAL Instrument Center, and the Summer for Applied Geophysical Experience (SAGE) program, fellow intern Yair Franco and I spent our first week camping out and installing broadband seismometers and magnetotelluric stations all around the Valles Caldera National Preserve. I had a great time exploring the caldera and learning first hand about both the type of data I will be processing as well as the geology of the region I am studying. The Valles has some amazing geology and amazing wildlife--we saw numerous elk, cows, coyotes, and prarie dogs throughout our field work. This picture is of a magnetotelluric site as we were installing it near Cerro La Jara, the smallest volcanic dome located in the Preserve.
Just a few days ago our fieldwork concluded and I drove up to Denver, Colorado, where I will continue to process the data we collected and have available from prior SAGE field work. As I settle into life at Denver, I have begun to reflect on my goals for this summer.
1. Enjoy life in a big city! And develop my skills at living alone and away from home.
I go to school in the small town of Houghton, Michigan, which has a permanent population of less than 8,000 and is located in remote northern Michigan. Living in a bustling city like Denver is a huge adjustment for me and will require me to broaden my horizons and discover new things. My goal is to be comfortable and familiar with the local resources and to enjoy living in Denver throughout this summer.
2. Explore and understand magnetotelluric data and it's applications to subsurface exploration.
Before this internship I had never heard of magnetotellurics. Right now I have a limited understanding of the technique. In the first half of my summer my goal is to develop a thorough understanding of MT data and how it is used to explore the subsurface. My goal by the end of this internship is to have a strong enough understanding of MT techniques to be able to identify future projects where MT can further our understanding of the subsurface.
3. Create a clearer path to my future (Grad school? Career?)
My goal at the end of this internship is to have a better idea of whether a career at USGS, or another research career, would be a good fit for me. Right now I am uncertain about what career path I would like to follow, or if I am interested in graduate school. By closely working with Paul at USGS and conducting research for the first time at this internship, I aim to determine if I enjoy this style of work. I am also listening to the paths each professional I am working with has taken to reach their currect position, in order to gain a better understanding of my options in the geology career field. While I still may not know what I want to do at the end of this summer, my goal for this internship is to develop a clearer understanding of what working for USGS is like and if I enjoy it.