Student applications for summer 2025 have closed as of February 15, 2025.
MENTORS can apply to host a RESESS or Geo-Launchpad intern by completing an application here.
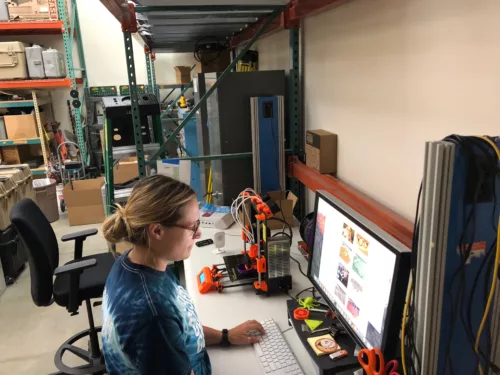
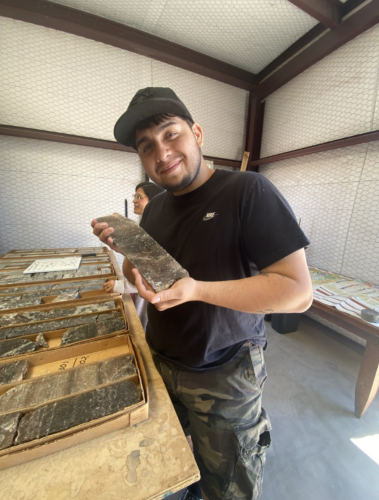
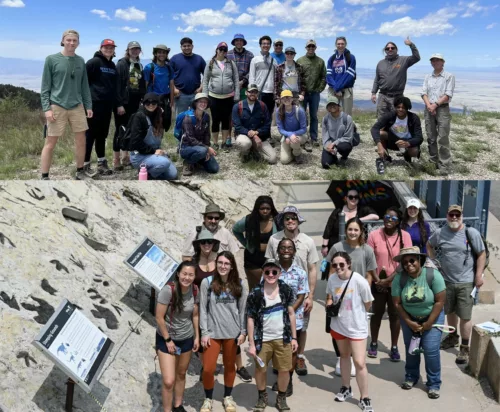
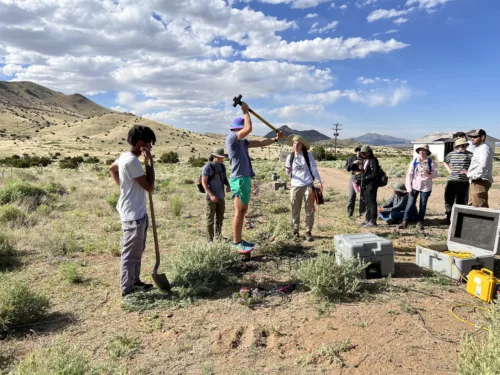
EarthScope offers a variety of paid summer internships for undergraduate and graduate students and recent graduates. These internships provide a spectrum of experiences ranging from research skill development, to full scientific research experiences, and others that provide professional work experience.
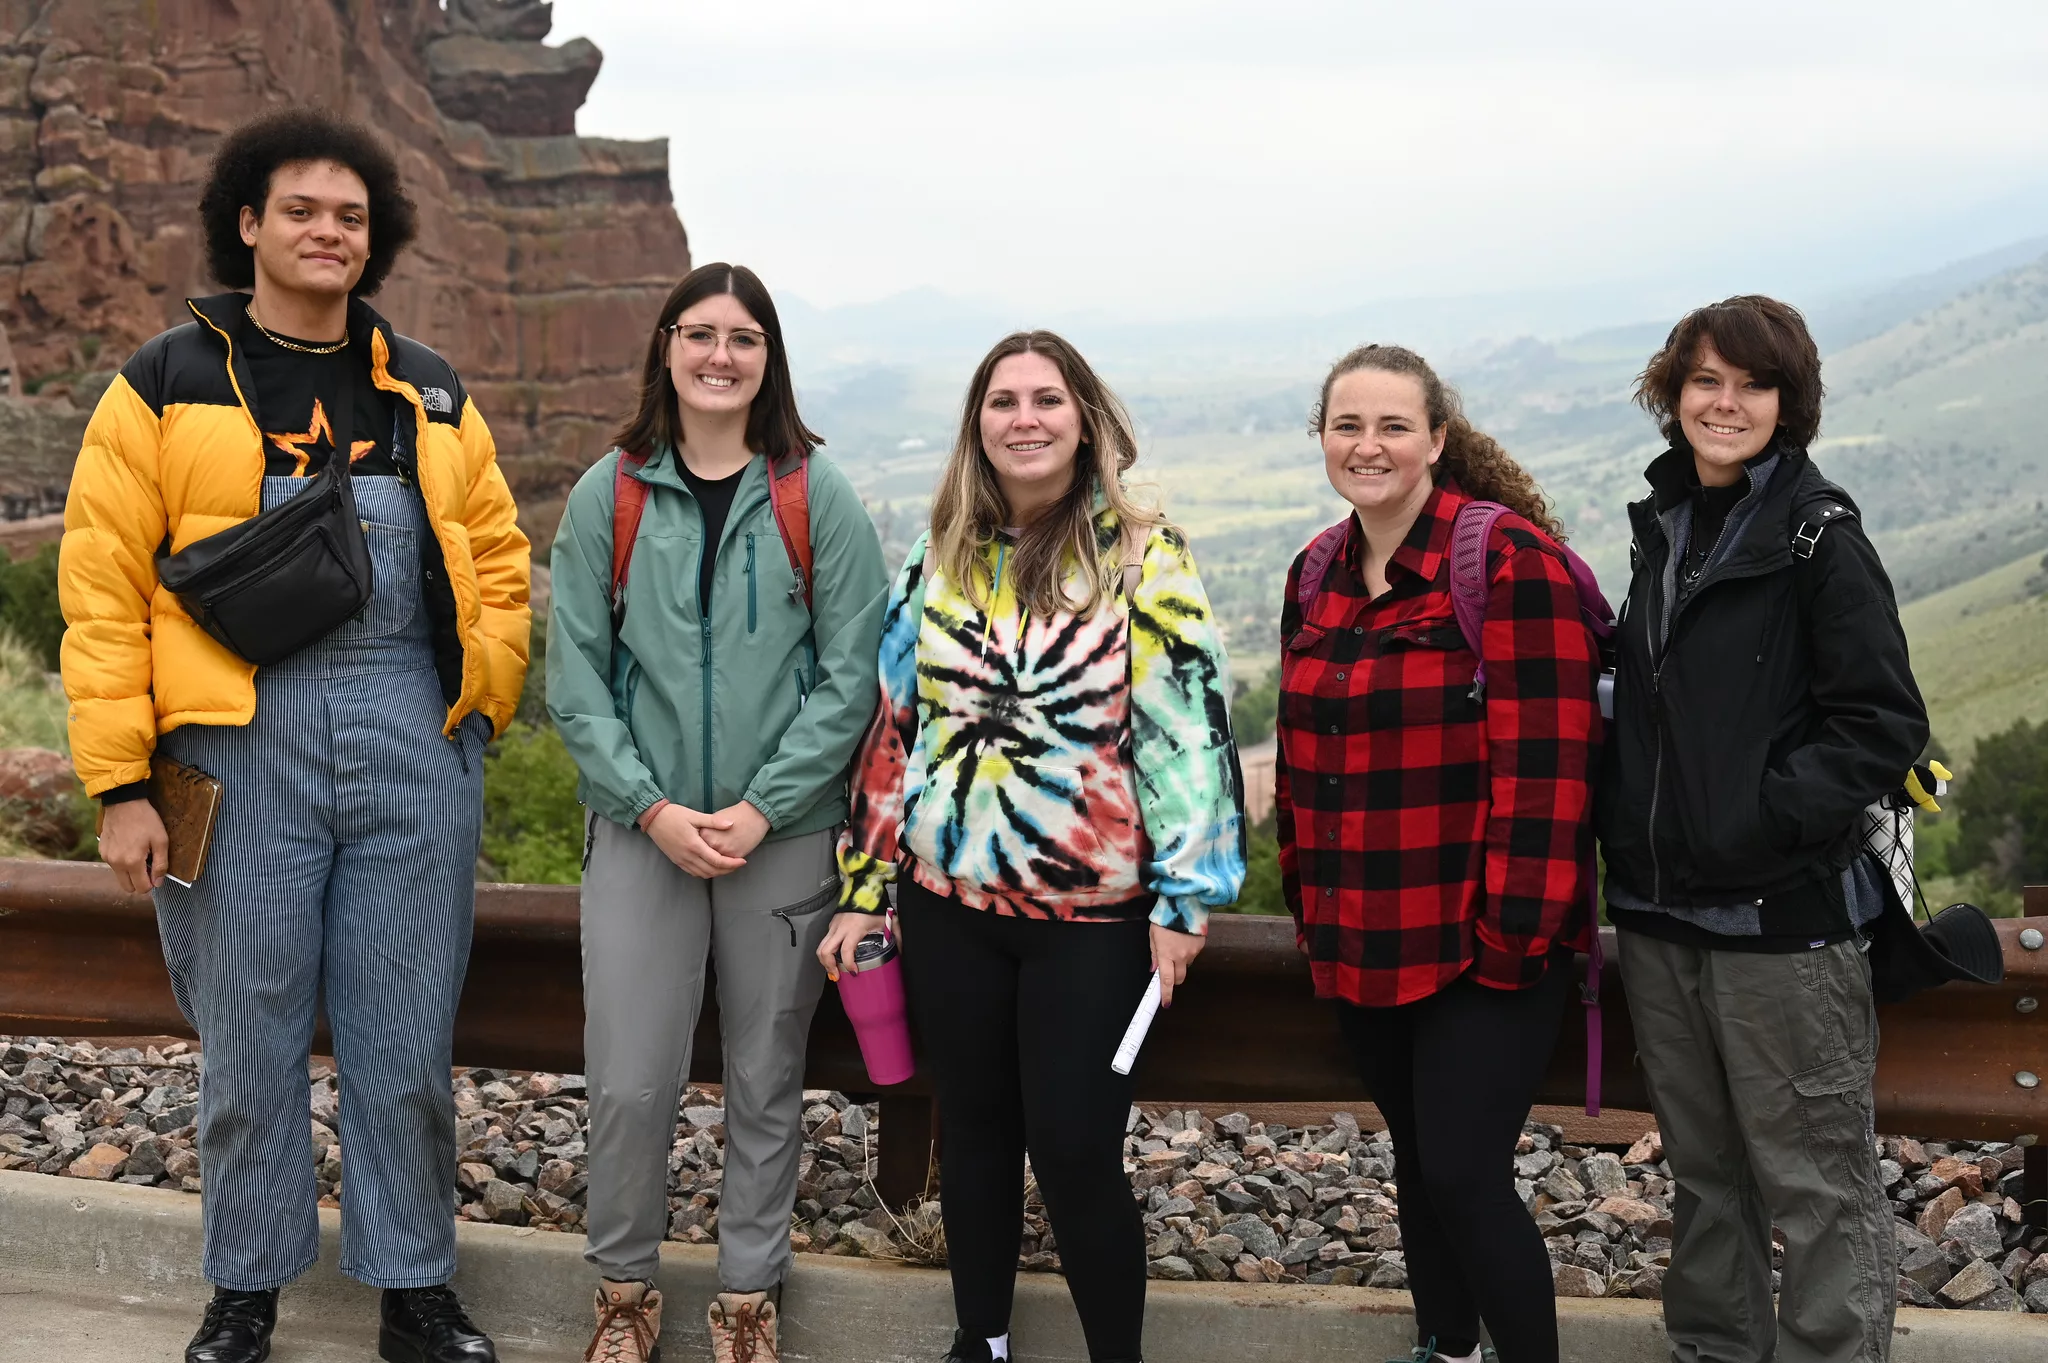
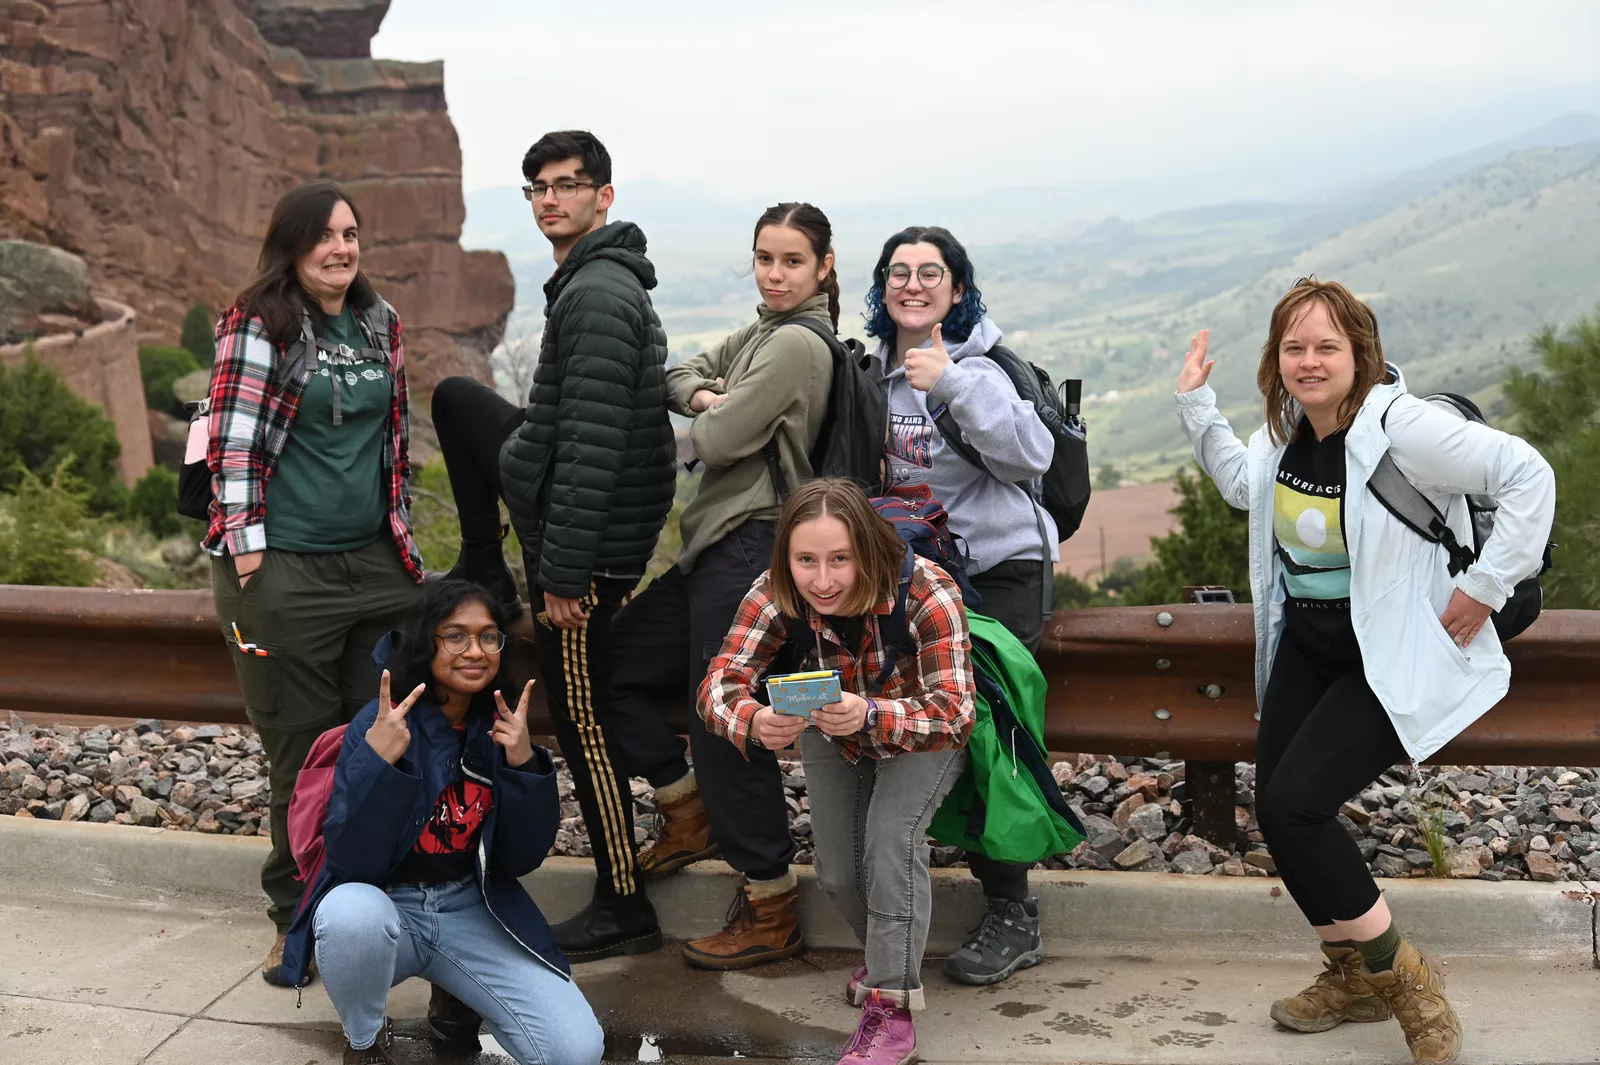
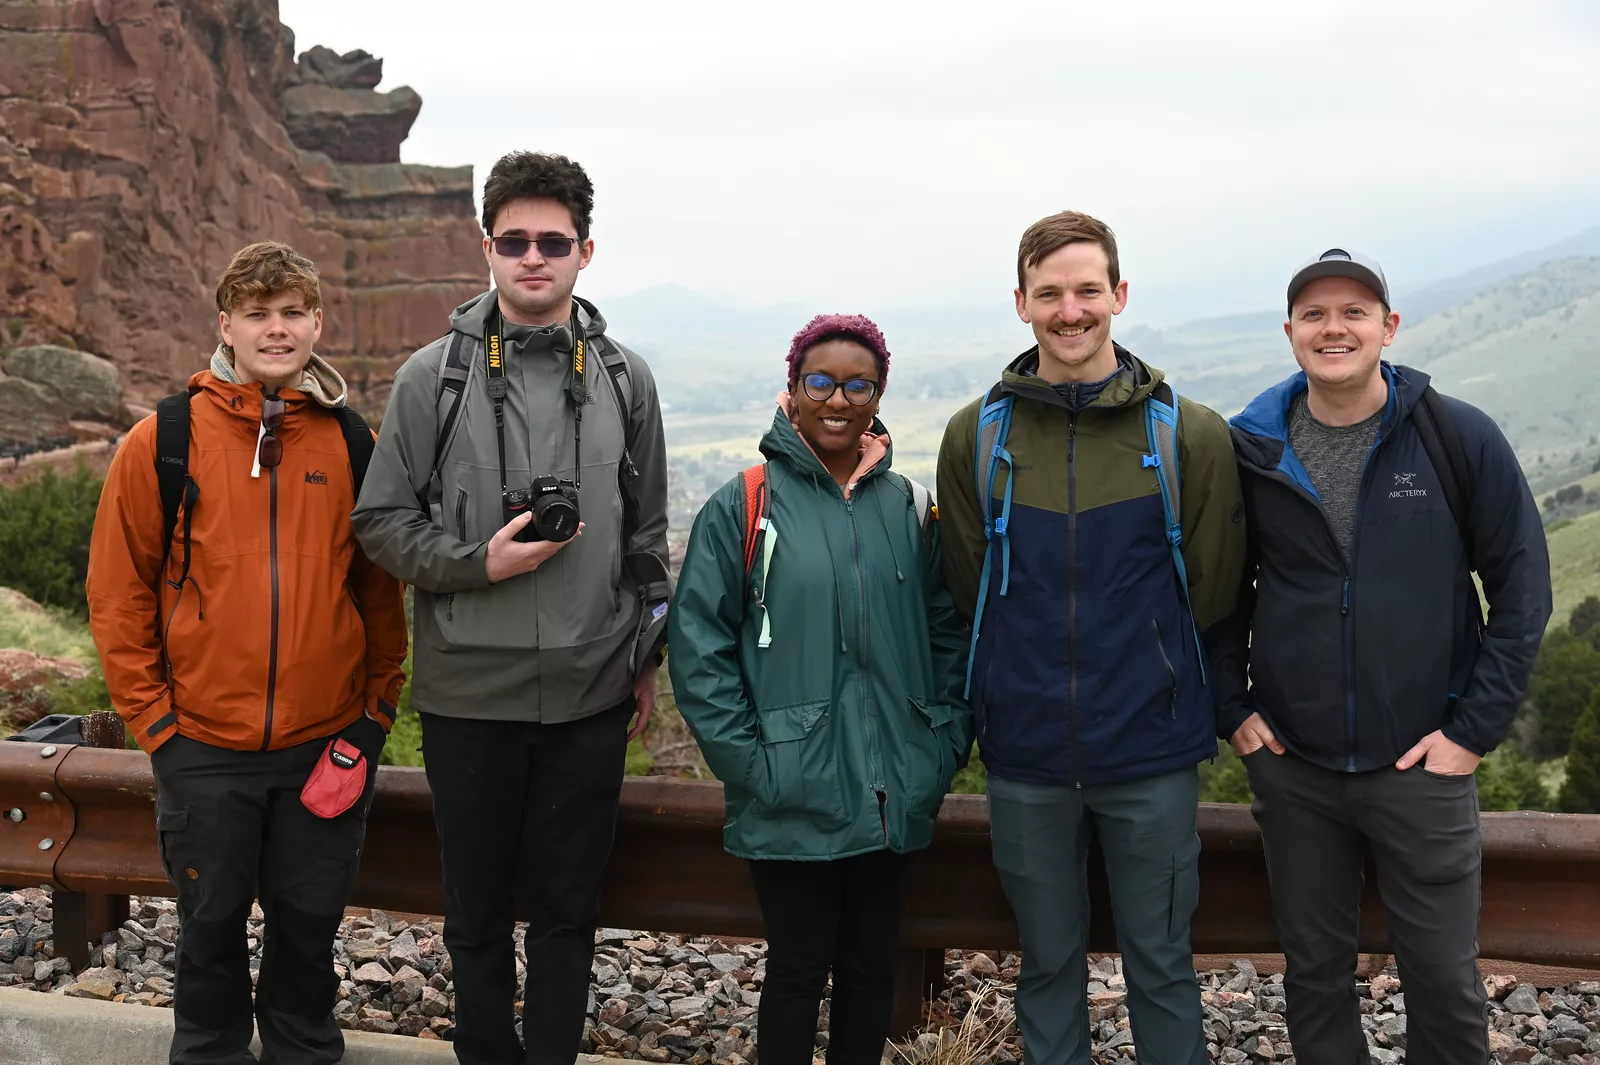
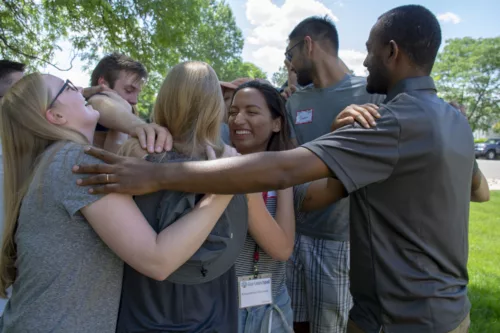
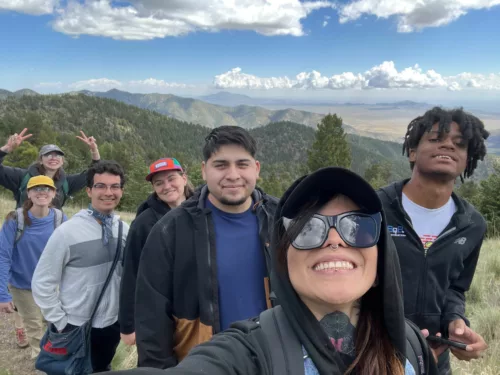
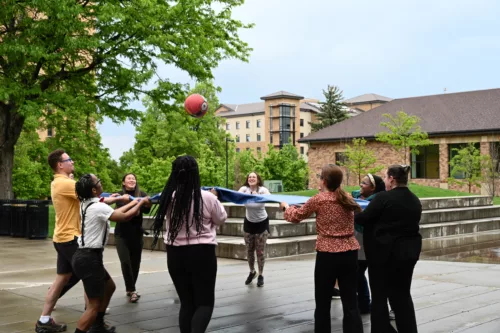
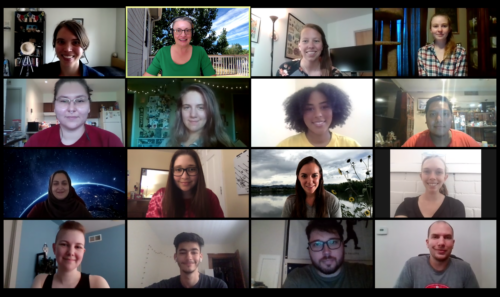
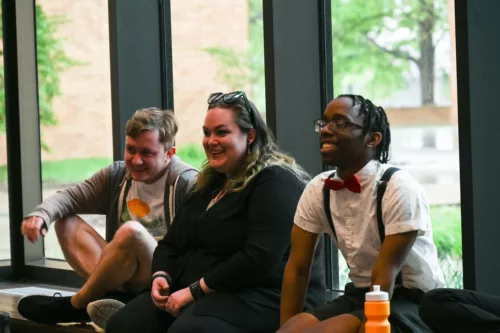
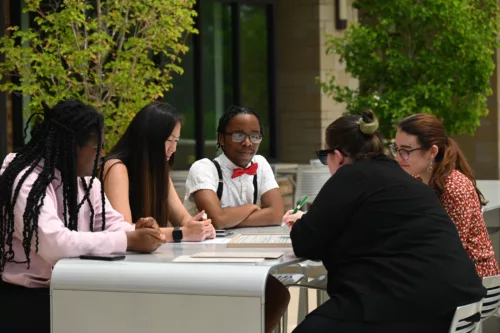
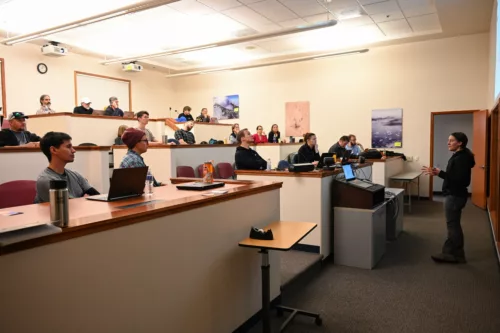
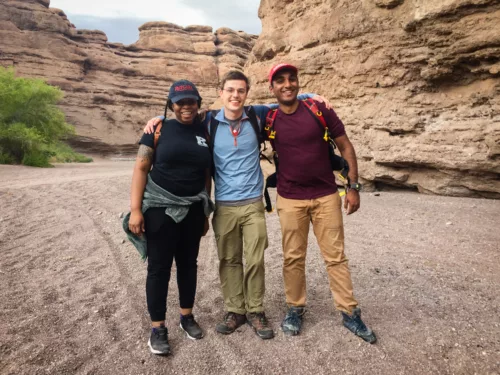
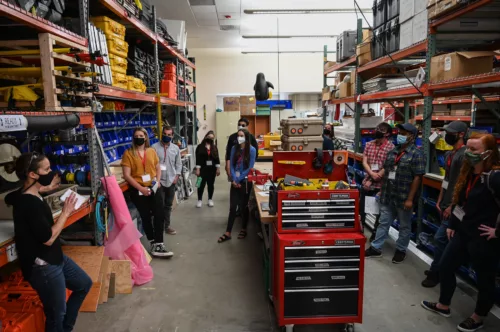
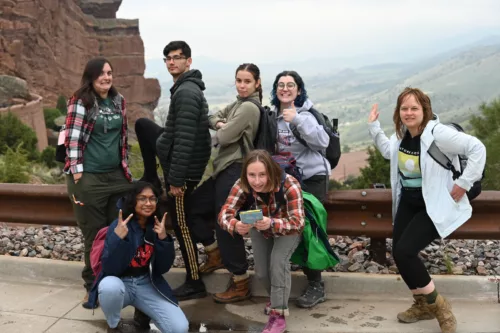
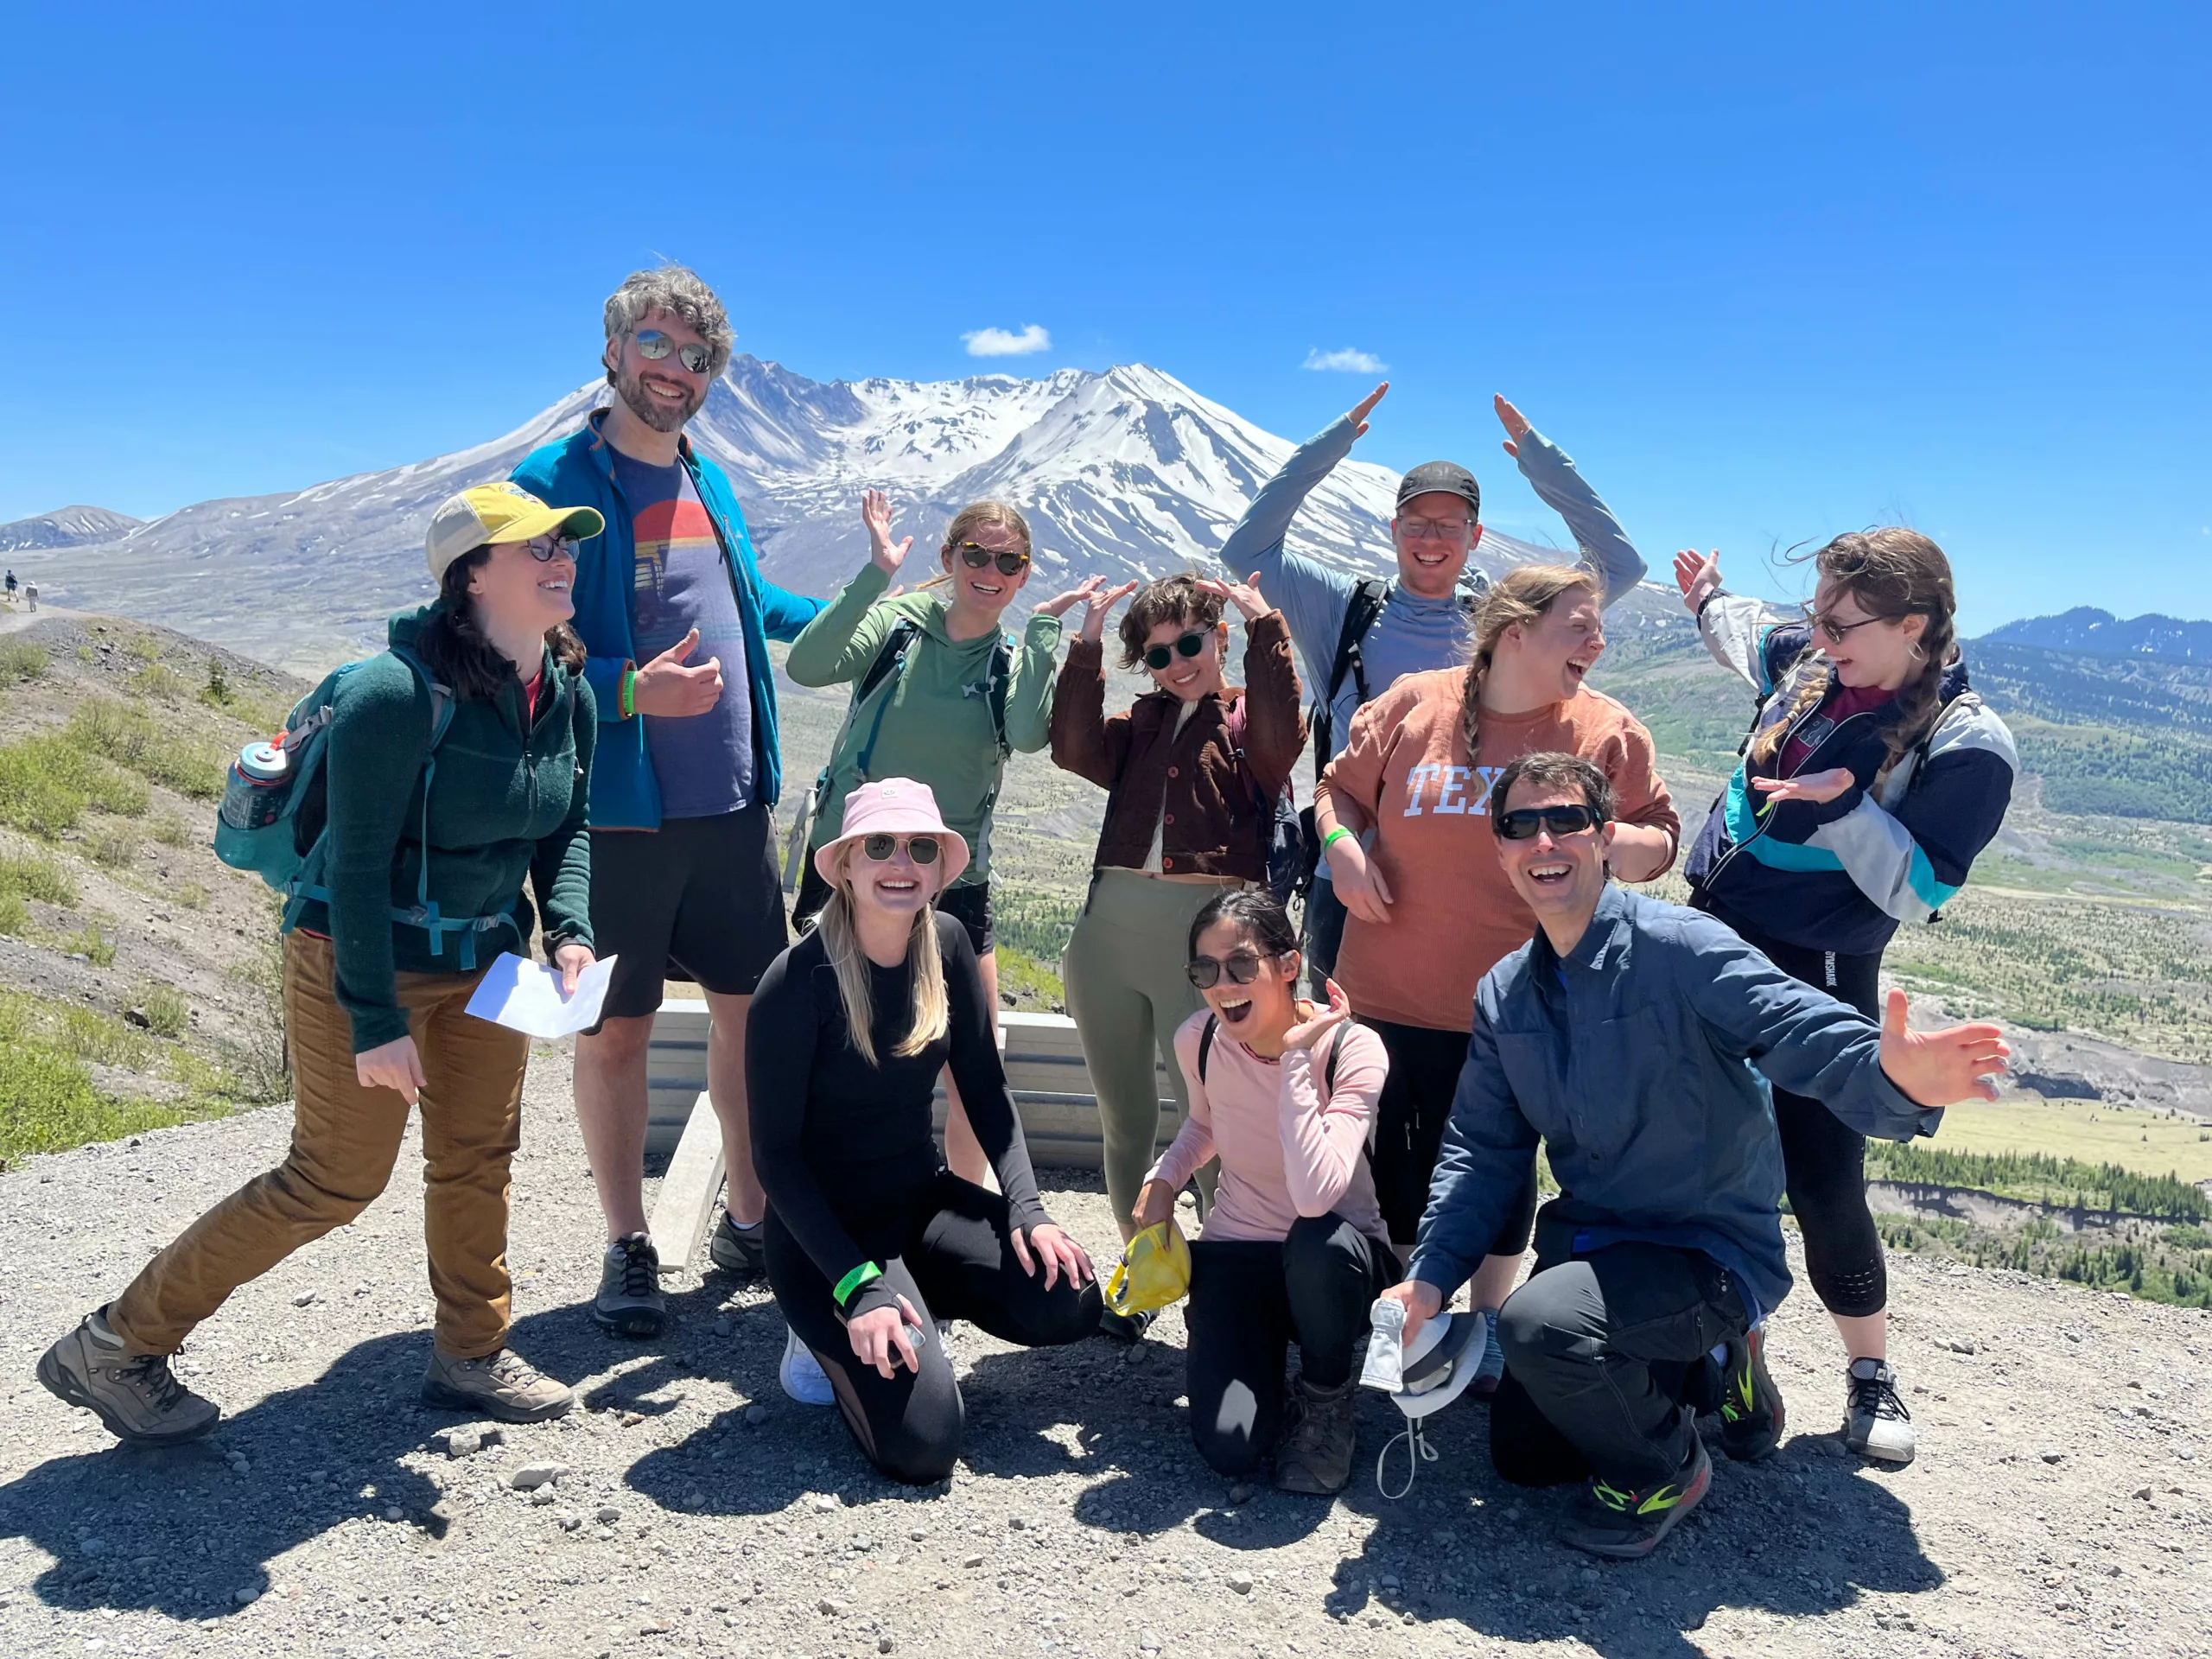
Through our student-focused programs we commit to providing a safe, engaging, supportive and connected learning environment to enable students to explore career possibilities within geoscience. Students are welcomed into a large community of diverse students, educators, and mentors, providing a network of support that extends beyond the summer programs.
We achieve this by:
- Carefully selecting diverse cohorts of students and mentors committed to student learning and growth.
- Providing mentor training on best practices of engaging with students and creating a supportive and constructive mentor/mentee relationship.
- Expanding knowledge of academic and career options.
- Offering a competitive stipend to allow students to focus on the experience.
- Individualizing professional development programming to focus on each cohort’s interest, such as communicating your science to the public through social media and exploring professional opportunities.
- Providing student training in bystander intervention and anti-harassment and discrimination training.
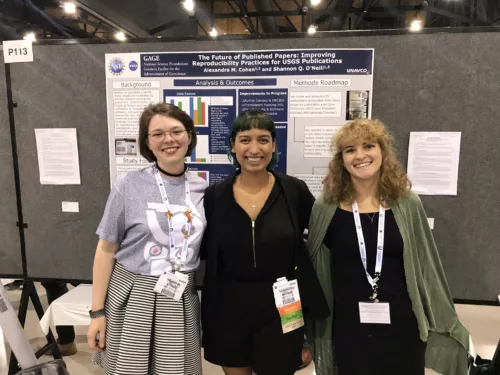
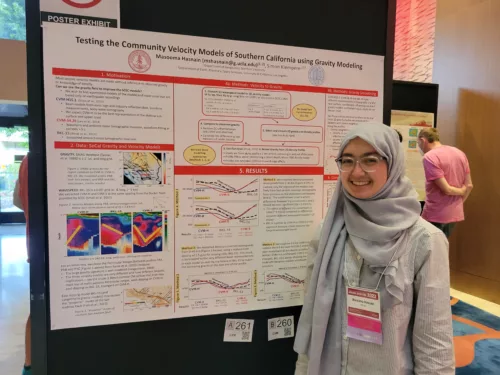
- Providing funding to support conference travel/attendance (for applicable programs).
- Providing experiences that contribute to students’ identity as a scientist, while recognizing the other identities they possess.
- Assisting students in finding their network, including membership to a professional society and connecting current interns to established alumni network, allowing cross-cohort collaboration and integration into the geoscience community.
- Supportive programming such as multiple mentors to address various aspects of student needs.
Explore the program pages above to learn more about expectations, candidate requirements, and application materials for each program.


