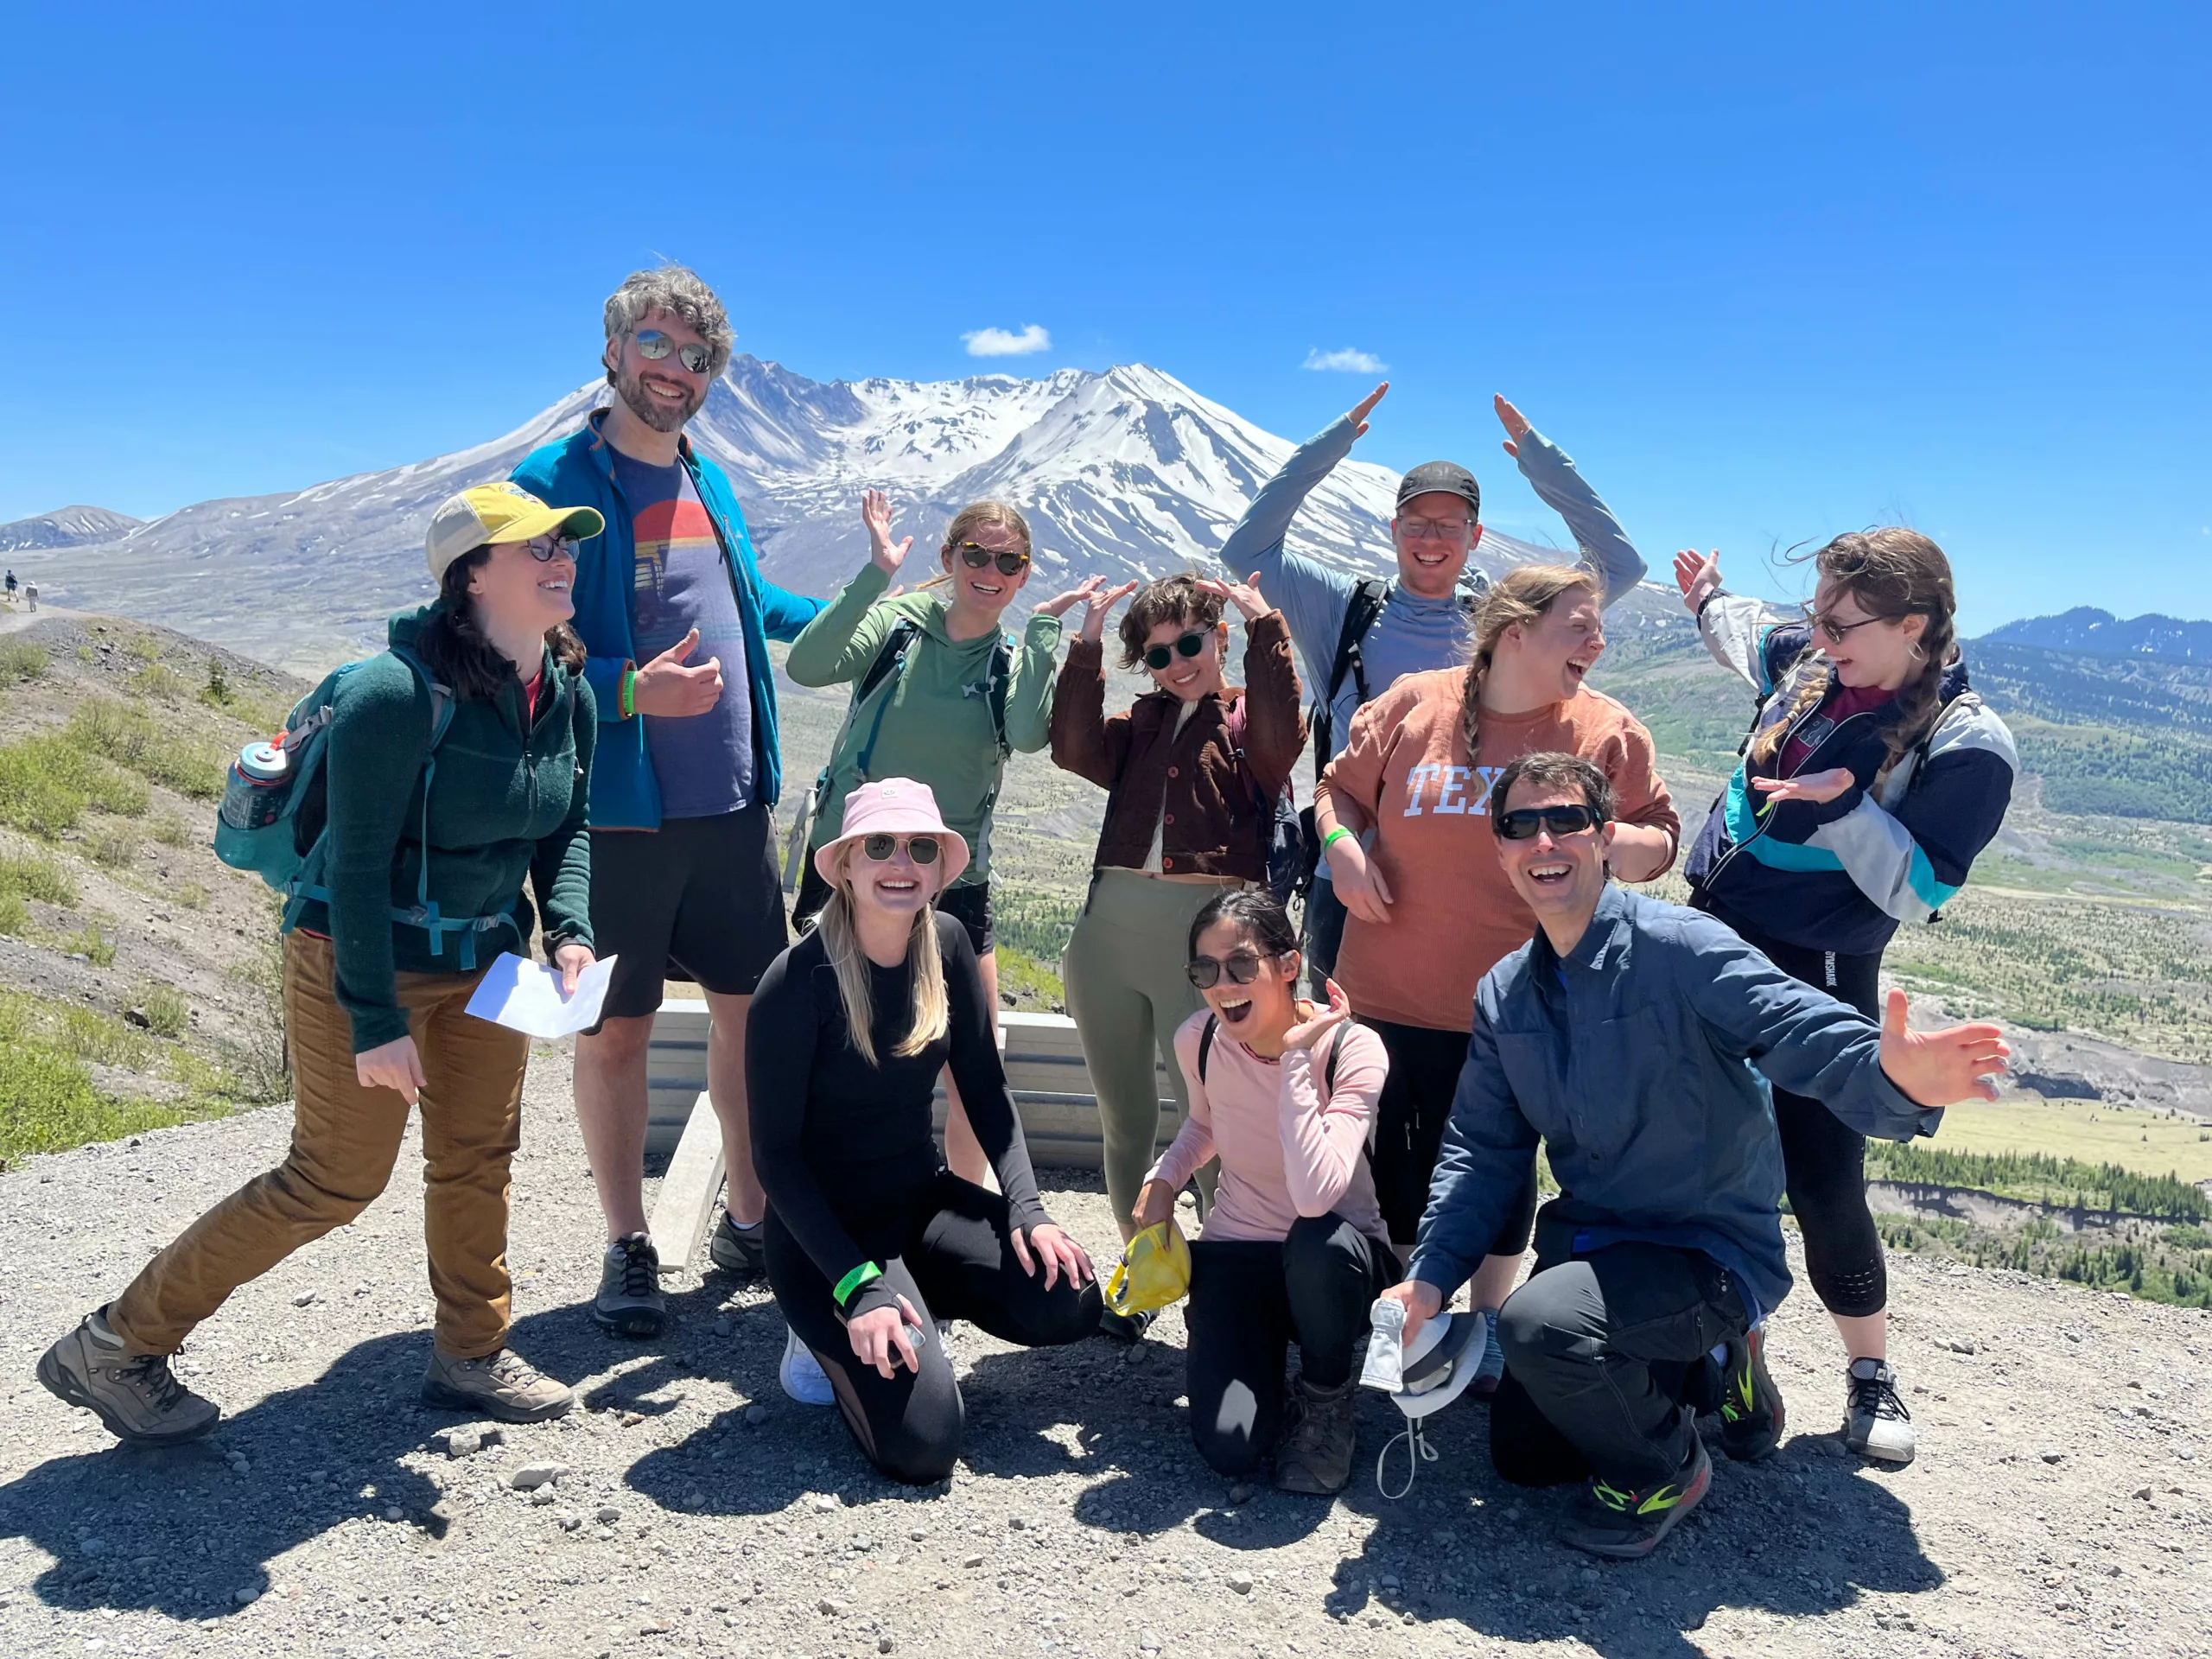
Grant_Clark is a student at Missouri S&T currently completing research at University of California, Riverside under Heather Ford.
Iceland is a island in the North Atlantic with a large amount of volcanism. This volcanism is fueled from the mantle by the Mid Atlantic Ridge as well as a mantle plume which overlaps with the spreading center. Previous studies into the structure of the plume have given some idea of size and shape but these still remain fairly uncertain. I will be analyzing data from preexisting seismic networks from 1996 to the present day, to measure the effect that attenuation has on arrivals below Iceland. This will allow us provide further constrain to the structure of the Iceland Mantle Plume.
For this blog post I wanted to cover the goals that I set during my first blog post. Just as a reminder what that covered, I had two groups of goals: professional and personal goals. My professional goal was to learn more about grad school and seismology as well as finishing my poster by the end of the summer. My personal goals were to see as much as I could out here in California, everything from volcanoes to mountains to the beach, as much as I could see.
I can confidently say that I have accomplished both sets of goals and much more than I had expected. My poster is only a few steps from being completed, filling in some text, making a figure or two, some interpretation, and cleaning things up is all that's left on that front. If you'd like to see the work that I have been doing you should come by my poster at AGU! I have also learned tons about graduate school and seismology and while I was pretty well decided before, I am now certain that I want to continue on to grad school. I really think that structural seismology is cool and would like to take my career further down this path.
My personal goals were accomplished far more than I really expected. I have had the opportunity so see so much of what California has to offer and I still feel like I haven't seen or been able to do everything that I want to do. We have been to Malibu and Huntington Gardens, Joshua Tree, Mecca Hills, and Mount San Jacinto, the Owens Valley, Eastern Sierra, and the area in and around the Long Valley caldera, and this past weekend (July 28 – 31) I went to Northen California to try and climb Mount Shasta, Mount Lassen, and drive along Route 1 along the coast. My volcano count for the summer is sitting at seven from my count based on where and how I visited each. I have seen the Coso volcanic field, Big Pine Volcanic field, Long Valley, Mono Lake and associated crates and domes, Mount Shasta, Mount Lassen, and finally the Clear Lake Volcanic Field. All of these are fantastically beautiful and absolutely warrant spending even more time out here in California in the future. I have certainly been able to see far more of this state than I thought I was going to be able to, but I still feel like there is some much more to do here. We couldn’t summit Mt. Shasta the day I tried with my friend; Mt. Lassen had so many trails and places to camp that we didn’t even get to see, and I wasn’t even able to make it up into the High Sierra at all. All this not to mention the places I didn’t get to go such as Yosemite, Sequoia, or the Monterey area and so much more. The biggest obstacle throughout the summer in this respect has been not having a car. This meant I had to rely on friends to take me places which was great but meant that I couldn’t go places if they ended up being busy. Overall, I have just concluded that I need to come back here to explore so much more of what this state and this side of the country has to offer. I still need to conquer Mt. Whitney, like I mentioned in the first post, so that alone means that I need to return.
I will be back.
I have reached the stage in my project where I have some initial results from the work I have been doing. Here we have created a map of t* measurements made with a linear inversion done in MATLAB.
The image above shows what this inversion looks like. These are initial results and will look very different from what my final results on my poster will look like, but they give us some idea of what that may look like. What we can see in this figure is that there seems to be an area around most of the Vatnajökull Ice Cap, which has higher attenuation than most of the rest of the island and much higher attenuation than the Faroe Islands. Attenuation can be affected by a wide number of variables such as temperature, water, and potentially even oxygen fugacity. We would typically see higher t* values associated with higher temperatures. What we see here is spatial correlation with the previously inferred location of the mantle plume below Iceland and higher t* values potentially indicating higher temperatures. Vatnajökull and its associated volcanoes are commonly referred to as “Iceland’s Hotspot” so to see some of our results potentially corroborating this looks promising. I chose this iteration of the inversion because I feel it also potentially shows bits of higher t* values along spreading centers in Iceland which would also have melt and higher temperatures. Examples of this are along the Reykjanes Peninsula and the Southern Volcanic Zone around Katla and Eyjafjallajökull. Coverage around the Reykjanes and the western part of the Island overall is poor and as such t* values in these areas are more susceptible to variation. Improved station coverage as well as the Bayesian inversion will help to work out these variations. We used stations on the Faroes to provide an off-island reference frame to compare our results to. They consistently show lower t* values which we would expect from older, colder lithosphere much further from a spreading center or hotspot. Later we will try to look at only on-island variations in these measurements to see if we can capture any smaller variations in attenuation. The final product that we will produce will be with a Bayesian Inversion rather than this simpler linear inversion. This will give a statistically more robust result allowing for a more accurate interpretation.
One of the more important papers that we have used for reference for this project has been “Insights into the lithospheric architecture of Iberia and Morocco from teleseismic body-wave attenuation” by Maximiliano J. Bezada. Dr Bezada is a collaborator of Dr Ford’s, and this paper goes through the same process as what we are doing with Iceland. We have been using this paper to better understand what we are doing at each step of the process, from making the t* measurements to eventually running the Bayesian inversion to come up with maps of attenuation. It covers a lot of the methodology and helps give us a better idea of what we are doing and will eventually help us come up with an interpretation of our results.
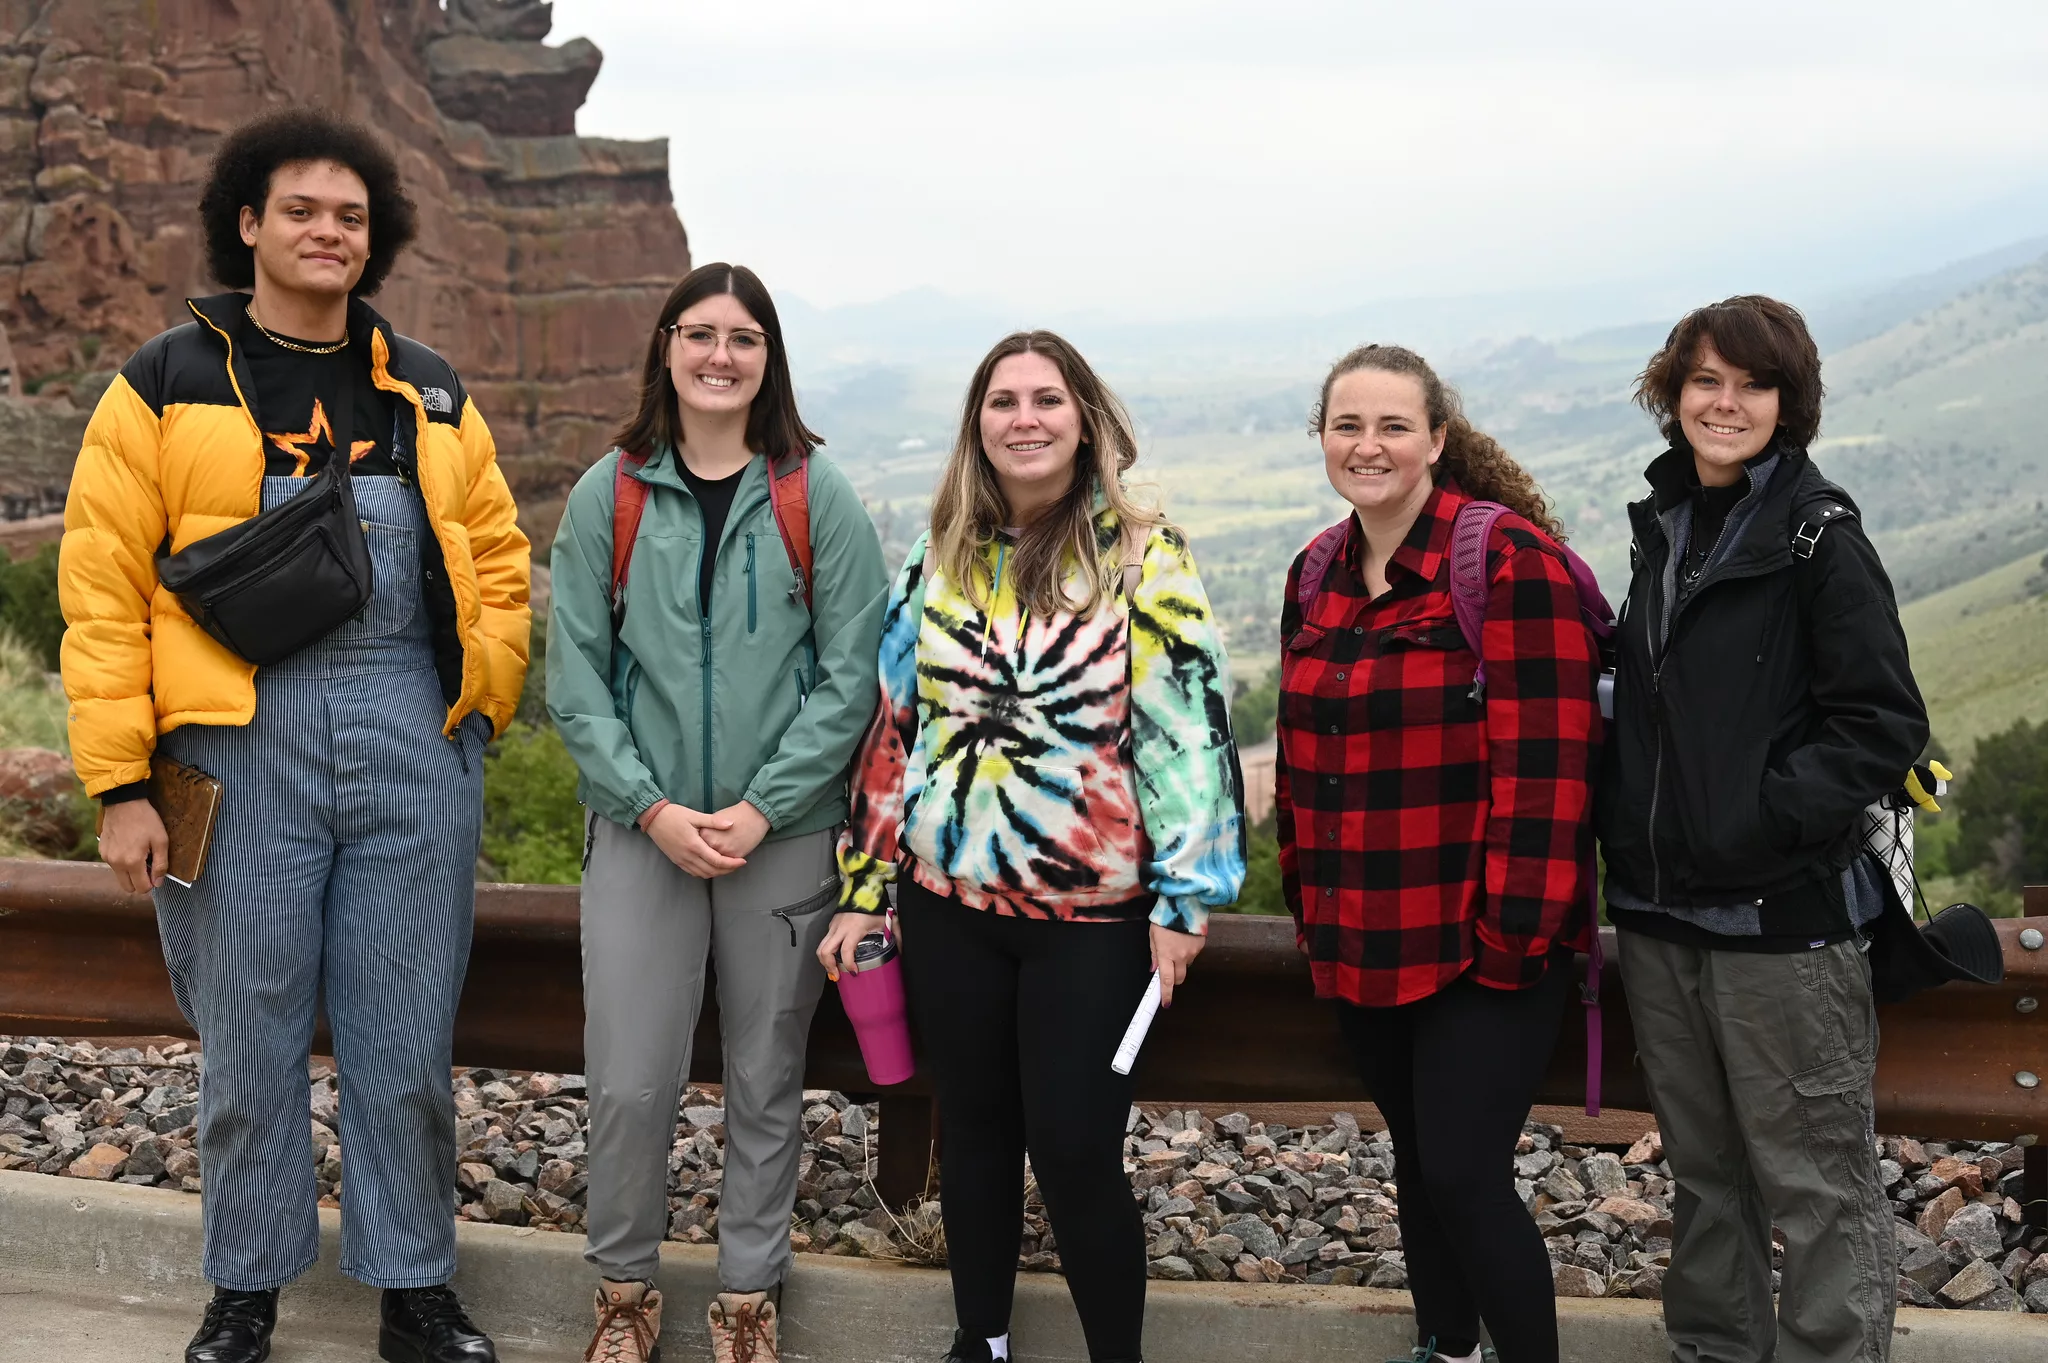
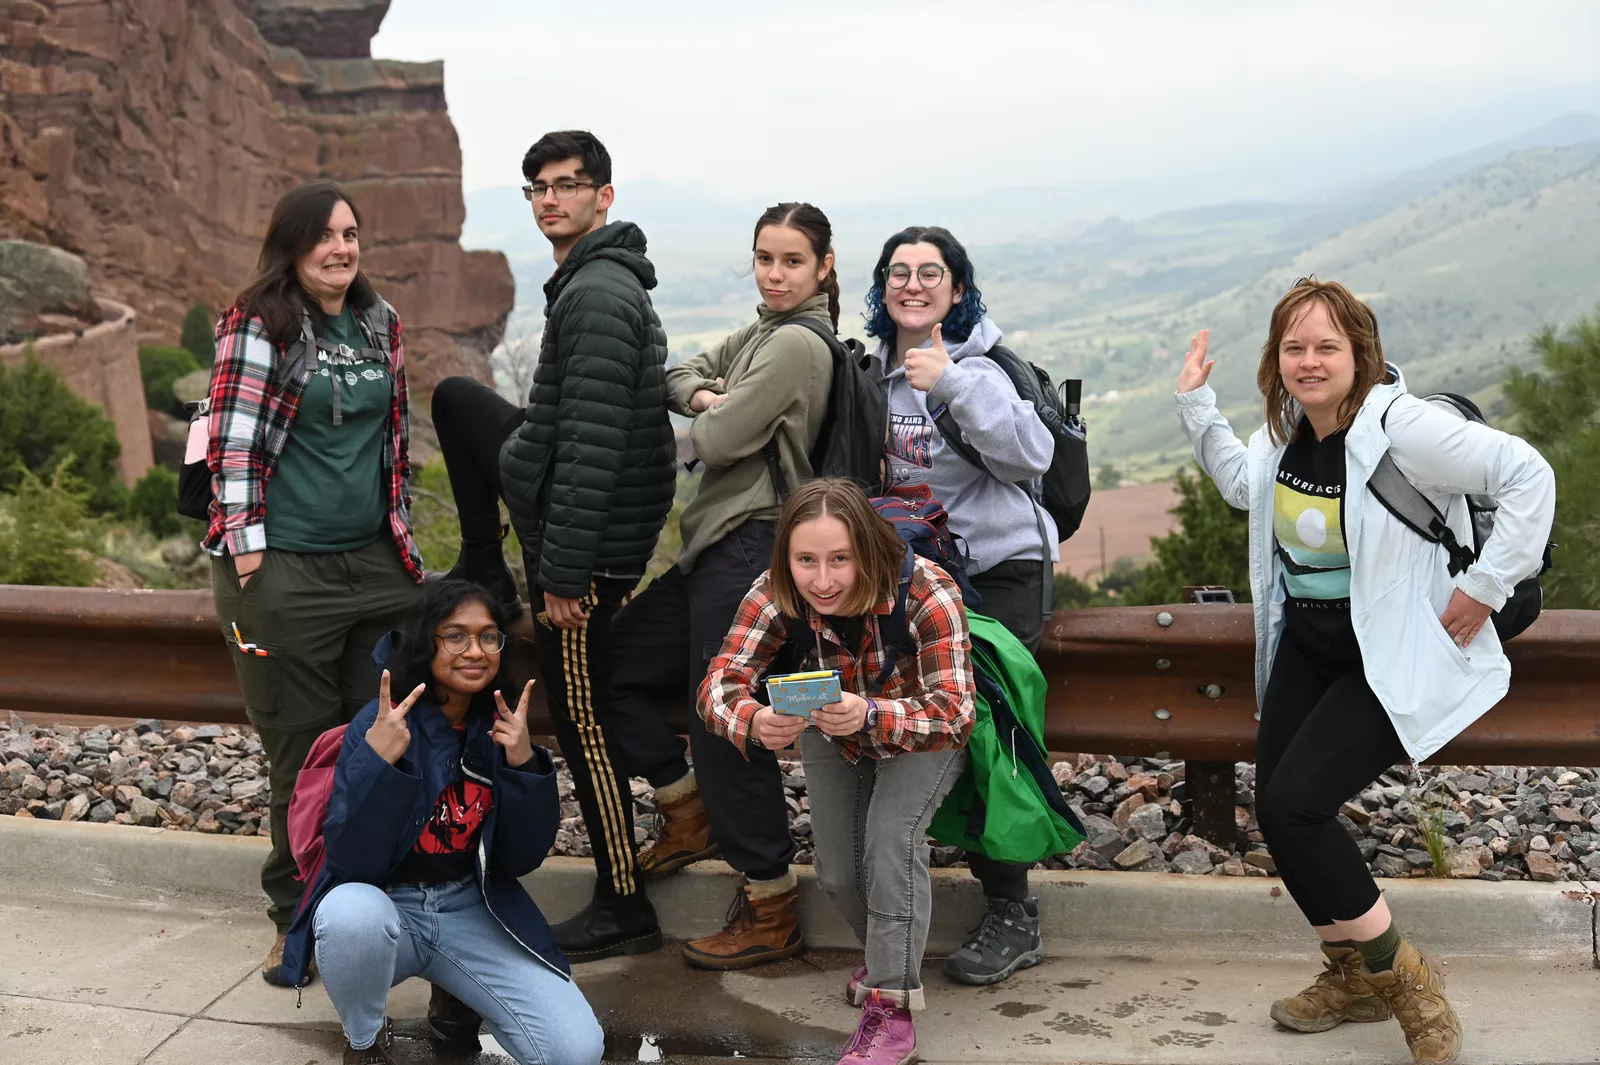
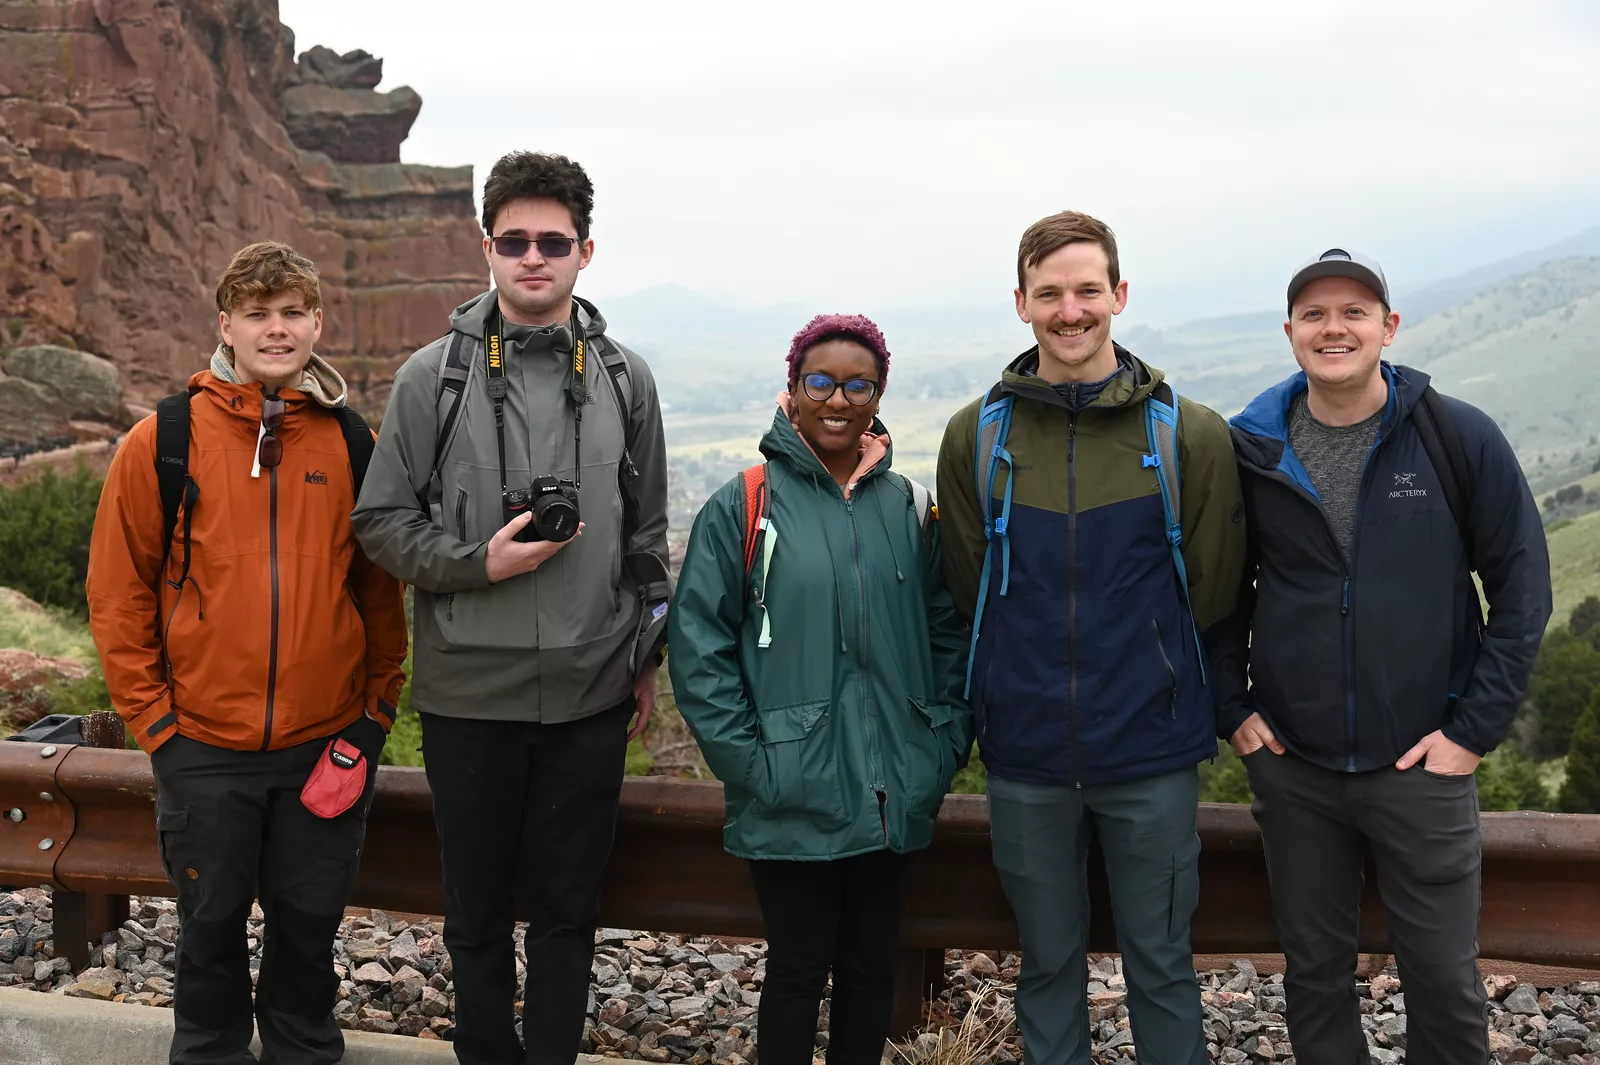
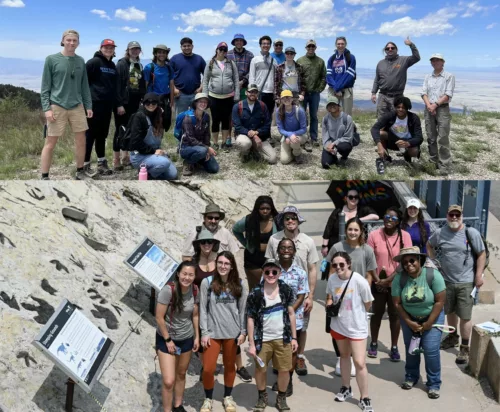
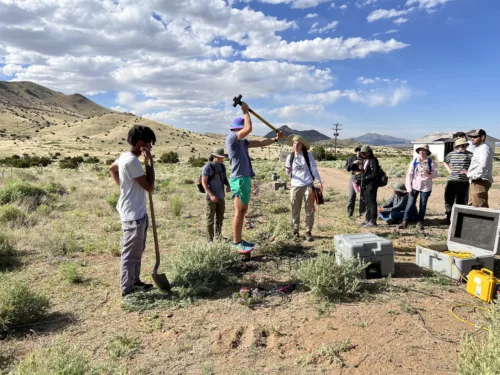
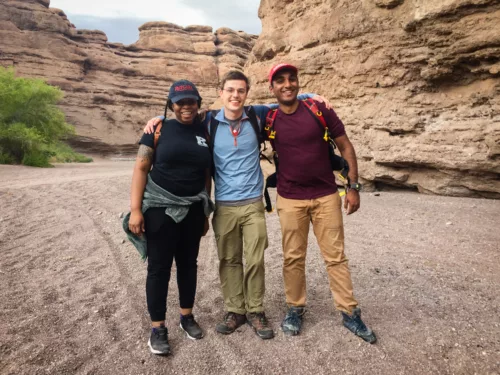
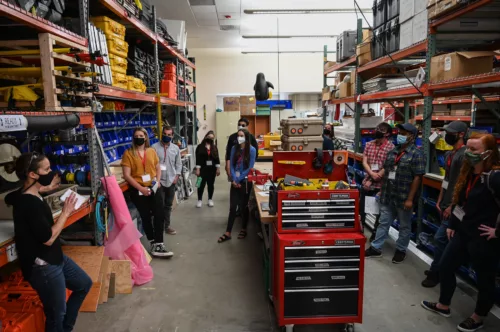
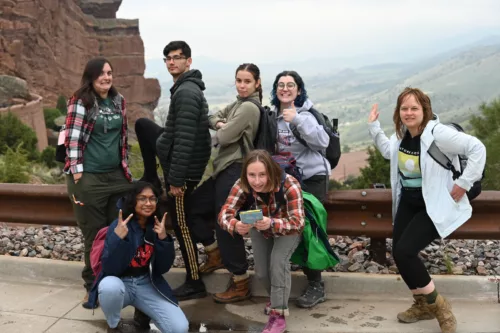
The final little piece here is some of the pictures from our past weekend. We spent the weekend at the SNARL (Sierra Nevada Aquatic Research Laboratory) in the Long Valley Caldera near Mammoth Lakes. We assisted Dr Ford and the UCR Field Camp with a seismic refraction survey near a cinder cone which is apart of the Big Pine Volcanic Field near Big Pine, CA. We used one line of geophones as well as a line of nodes which will hopefully yield high quality results. We also showed them the process of installing a broadband seismometer and how to use a magnetometer which they used to take measurements around the cinder cone. Apart from the field camp team we were able to make some geotourism stops including the Coso Volcanic Field, Alabama Hills near Whiney Portal, Hot Creek hot springs, Convict Lake, and more hot springs where we were able to relax and observe the light pollution free night sky two nights in a row. We also watched the sunrise over Mono Lake and visited Obsidian Butte before we returned back to Riverside.
Top two images are of the day we did field work. Bottom left from left to right is me (Grant), Dr Ford, Leah April, Anah Bogdan, and Jordan Winn (another intern from Riverside) at Obsidian Butte. Bottom right is the sunrise over Mono Lake. Thanks to Jordan for the bottom two images.
Hi Everyone,
This week they want us to show a map figure that we've made during our projects and to talk about some frustrations and successes that we've experienced. This works well because my maps can help to explain my frustrations. The first map I made was a map of all the stations that were recording during the time period that we are looking at (1996 - 2023). All the different colored triangles represent a different station with the different clusters of stations being different network arrays. Not all the stations were running for the whole time, and most were only running for a few months. The second map is of earthquakes that occurred during our time period but with a few specifications. As you can see on the right of the map there is a legend with the event depth color bar. Events shallower than 200 km experience too much scattering during their travels to use for attenuation so our events had to be deeper than that. Next, we needed events that were 30 (red) - 90 (yellow) degrees on a globe from the rough center from Iceland. This ensured that the waves that were arriving at the stations have the right angle of incidence for sampling the Earth below Iceland. Also, we needed events that were larger than 5.5 in magnitude so that they would have clear enough arrivals on our stations. I would say that these maps are the clearest examples of progress that I have to date, not that I haven't made progress but the other progress I have made isn't easily shown.
That leads me into one of the main projects that I have ran into on this project. The main part of the project that has been the hardest to wrap my brain around has been understanding what attenuation looks like on a real recorded earthquake and telling when I have made a good measurement. Attenuation basically is the wave being pulled and stretched out from its original form. This makes the waveform look mushed and stretched out compared to a similar wave that isn't attenuated. For this project we downloaded what each station that was recording at the specific time when waves from an event should have reached the station. For a lot of these events, the traces are too noisy to see any P wave arrivals and so we can't use those events. The ones that are clean with minimal noise and where we can clearly see the waves arriving are the ones that we use to make a measurement. I look at a big list of all the stations that were running at that time, line up all of the spots where the wave arrived, and then determine which of those goes into making an estimation of what the original source earthquake looked like before the wave got attenuated. It's important for me to choose the stations that have the most unattenuated wave forms so that the source estimate is as close as possible to reality.
This is the hard part.
Seismograms can be a lot like rocks. I mean this in the way that in a class or lab, they can show you a nice perfect example of what pyrite or calcite looks like, but often when you get into the field, those rocks very rarely look like the ones you saw in lab. The most unattenuated waveform isn't always the most obvious. A lot of the time I have spent over the last few weeks has been trying different combinations of stations on an event to determine which ones are the unattenuated ones and which ones have been attenuated. Only a few of the events that I have are nice, clean, and free of noise which helps a lot because when noise is present it can make taking a measurement of attenuation that much harder. I take notes in a lab book that I keep next to me so that I can reference back to it when I am trying different things. I have spent roughly the last two weeks working though the nicest of the events that I have trying to get a better idea of what stations I need to use and which I leave out and it’s been going very well. I work with my mentor to get a second pair of eyes on the work I've done so that if there are issues with something I might have done, I can go back and fix it. I have also been talking to Dr. Brynes, Leah's mentor, because he is the one who wrote the code I am using, and he has also been a great resource for wrapping my head around this difficult subject.
Overall, things are going well and in the next few weeks I should be able to take the measurements and put them through the inversion code to come up with a model for attenuation. At that point it should be tweaking measurements and inversion parameters until I have something that is presentable for AGU. We also hope to have my abstract done and ready to submit in the next few weeks, which is very exciting. On another note, this week we are taking a field trip to Joshua Tree, Mecca Hills, and the Thousand Palms Oasis where we will get to see the San Andreas Fault. Next weekend, we will be spending the weekend with the UCR Field Camp at the SNARL lab in Long Valley. We'll be helping them with a refraction survey and generally on a geoturism adventure which I am very excited for. Looking forward to the next few weeks.
I am looking at the attenuation that seismic waves experience as they pass through the upper mantle and crust. To do this, we need to look at how the arriving waves are affected by the structure for many earthquake events at different incidence angles. What this means is that we need many events at several stations on Iceland from an ideal range of 30 - 90 degrees from the approximate center of our project area to get an accurate picture of attenuation in the area. We are using earthquakes which have a magnitude larger than 5.5 and which have a depth greater than 200 km. This allows us to collect events far enough away and avoid scattering issues that arise with earthquakes that are shallower.
Iceland has had a number of seismic networks running semi-continuously since 1996. Some attenuation work was published in 1999 using the HOTSPOT network, which was a backbone array across the whole island, running from June 1996 to August 1998. I will be building upon this work using more data collected from 27 other potential networks that have been run since 1996. There are only 2 - 3 stations that have been running for the entire span from '96 to '23, so most of the networks that are being used are from other projects in Iceland. These include the BORG station from the II network, ISKR station from the VI network, and two stations from the GB network, which is on the Faroe Islands. Many of these are centered around the volcanic centers in Iceland, primarily the Eastern Volcanic Zone, Northern Volcanic Zone, and the Reykjanes Volcanic Belt. While most of these networks are in Iceland, we have also decided to use data from several networks placed on the Faroe Islands to get a baseline measurement some distance from our project area.
In total, using the parameters above, we have gathered 180 events from 01-01-96 to 06-01-23 which have been picked up on any of the stations in the networks available through the IRIS DMC. The program that we are using to make attenuation measurements for each event was provided by Leah April's mentor, Dr. Joe Byrnes at Northern Arizona, who has been a collaborator of Dr. Ford's for several years. We download the waveform traces from each event on all of the stations that have that event in a MATLAB file that can be opened by the program. Many of the 180 events that are downloaded may not be of the highest quality, or may not actually be real events, so quality control is needed to weed out bad files. I opened each file in the program and determined if there was an event, if there was too much noise on the event, if there were enough traces to make a measurement, etc., and I gave each a letter grade to indicate if it was worth using. I now have what I consider to be 34 A's, 30 B's, 39 C's, and 76 F's. A's are definitely good events, B's are events that are clear but may have lots of noise or other issues, C's are ones that have an event but are very messy and probably can't be used for measurements, and F's are traces that only have 1 or 2 stations or simply have no clear arrivals of seismic waves. One event outright crashed the program and couldn't be opened. I have no idea why this happened, but I will figure that out in the coming weeks. From here, I will begin making measurements with the A's and work through those as best I as I can.
I also filled out a self-assessment guide to evaluate my skills as they currently stand. One of these skills that my mentor and I have decided to highlight and work on over the summer is keeping and maintaining a logbook. The importance of keeping this book has already been made very clear as I have begun trying to make measurements. Especially in the beginning while I'm still getting a feel for how it should be done, I am having to do many iterations where only a few parameters have been changed. Keeping track of what parameters I used and how I've changed them each iteration is helping me learn better what I should be looking for each time I make a measurement. It allows me to recall exact information about what I did later on when asking my mentor or others for help, meaning I can get much clearer and more detailed responses. I try to write down everything that has a number or an input on my part, so that anything that may be used in the future is recorded.
I have two groups of goals for this summer: professional goals and personal goals. The professional goals cover what I want to accomplish specifically for the URISE program and my internship. I'm hoping to and already have, learn much more about seismology and graduate school in order to set myself up for a better future. Getting most of my poster created before leaving California this summer would be a major accomplishment and is my main goal. I don't want to have lots of work to do once I get back to school so that I can soley focus on the semester and preparing for the AGU meeting. Finer goals are still a bit hard to define at this point since we aren't sure about how long processing the data will take and how results will look.
My main personal goal while I'm here is to go to as many parks, mountains, and volcanoes as I can. We already have plans to drive from Riverside to Long Valley and Mammoth sometime in July and we'll be stopping at a number of volcanic fields along the drive up. I'm planning another trip with a friend to attempt Mt Whitney sometime before the end of the summer. Very much looking forward to the rest of the summer and completing as many of my goals as I can.