How can we understand the relative scale of Earth's layers?
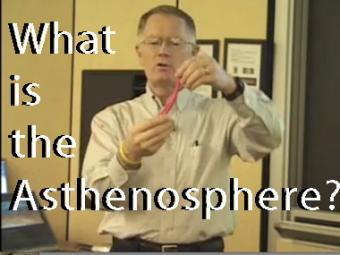
This classroom lecture presents a simple conceptual model of the relative thicknesses of the Lithosphere by measuring a simple hard-boiled egg. The hard-boiled egg is used as a scale model for the zones of the Earth. The shell is to the egg as the lithosphere is to the Earth. This demonstration highlights the idea that the lithosphere is a thin shell.
Compare the relative thickness of the shell of an egg to the lithospheric "shell" of the Earth

Silly Putty is used as a model to show how the asthenosphere is elastic when exposed to short-duration forces (like seismic waves) but plastic when exposed to long-duration forces (like the load of the Hawaiian Islands on the Pacific Plate).

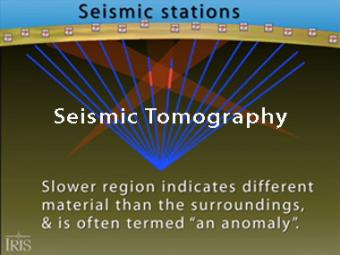
Seismic tomography is an imaging technique that uses seismic waves generated by earthquakes and explosions to create computer-generated, three-dimensional images of Earth's interior. CAT scans are often used as an analogy. Here we simplify things and make an Earth of uniform density with a slow zone that we image as a magma chamber.

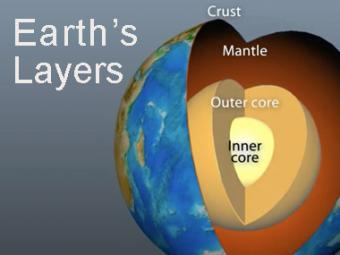
The Earth has 3 main layers based on chemical composition: crust, mantle, and core. Other layers are defined by physical characteristics due to pressure and temperature changes. This animation tells how the layers were discovered, what the layers are, and a bit about how the crust differs from the tectonic (lithospheric) plates, a distinction confused by many.

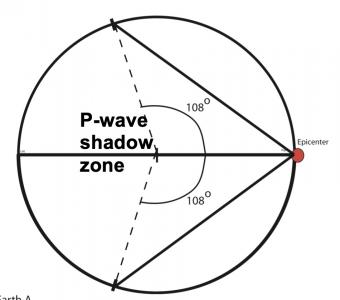
Students work first in small groups, and then as a whole class to compare predicted seismic wave travel times, generated by students from a scaled Earth model, to observed seismic data from a recent earthquakes. This activity uses models, real data and emphasizes the process of science.
We encourage the reuse and dissemination of the material on this site as long as attribution is retained. To this end the material on this site, unless otherwise noted, is offered under Creative Commons Attribution (CC BY 4.0) license