In this lab, students attempt to answer the question “What causes icequakes in Greenland?” To accomplish this, students use Google Earth to examine both the spatial distribution of the icequakes, as well as the physical features of the glacier in regions where icequakes occur. Next, students examine the temporal distribution of the icequakes and compare this evidence to monthly and annual mean air temperatures in Greenland. Finally, students synthesize the evidence they have collected to create a multi-paragraph explanation of how icequakes in Greenland exemplify the concept of “Earth as a system.”
Before undertaking this activity, students should understand the basic causes of earthquakes (e.g. Elastic Rebound Theory).
Students will be able to:

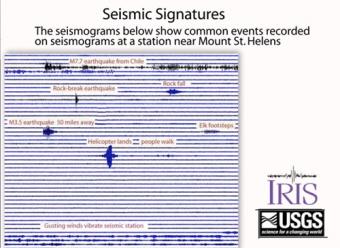
Seismograms of common events are compiled to show the different seismic signals recorded by ground-shaking events. Seismograms can record everything from nearby earthquakes to earthquakes on the other side of the world, plus anything that shakes the ground near the seismograph station like people walking, elk running, rocks falling and helicopters landing.

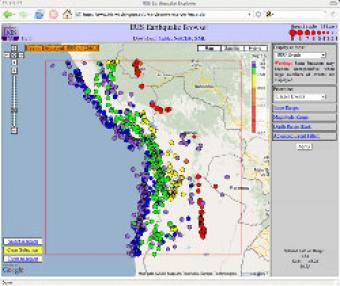
The IRIS Earthquake Browser (IEB) is an interactive tool for exploring millions of seismic event epicenters (normally earthquakes) on a map of the world. Selections of up to 5000 events can also be viewed in 3D and freely rotated with the 3D Viewer companion tool.
We encourage the reuse and dissemination of the material on this site as long as attribution is retained. To this end the material on this site, unless otherwise noted, is offered under Creative Commons Attribution (CC BY 4.0) license