Let’s say a big earthquake occurs somewhere in the world and you want to know a bit about it. This can be accomplished quickly by using broadband data from the IRIS DMC (Data Management Center) and some coding in Matlab. In this excercise students will learn to download .sac files from the DMC and load those files into Matlab for examination. The activity focuses on enabling students to locate the event based on P arrivals and then caculate the magnitude of the event.
This exercise was developed by Susan Bilek at New Mexico Tech (sbilek@nmt.edu) and used as part of the IRIS Interhsip Oritnation Week.
Students will be able to:

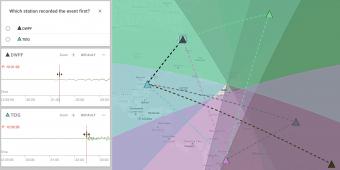
EqLocate is a suite of interactive apps giving users the opportunity to choose their preferred earthquake location method and specific earthquake they want to analyze. Through these easy-to-use tools, learners explore real data from recent and historic seismic events gaining valuable hands-on experience in earthquake locating techniques.

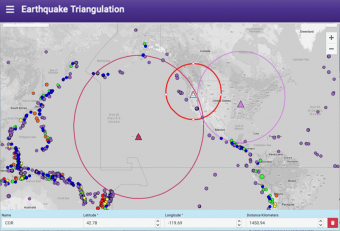
Easily plot stations and distance circles on an interactive world map to demonstrate how earthquakes can be located using the time difference in the arrivals of P and S waves at a set of seismic stations.

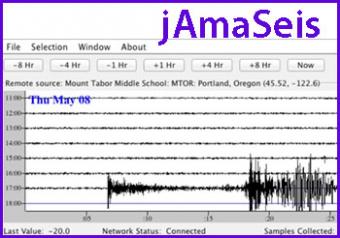
jAmaSeis is a free, java-based program that allows users to obtain and display seismic data in real-time from either a local instrument or from remote stations.

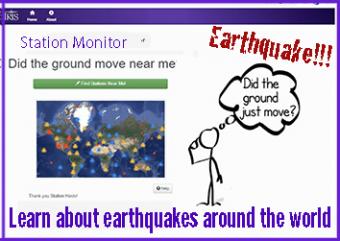
A beautiful map of the latest earthquakes in near-real time. The map also provides links to related resources, news, and connections to 3D maps.
We encourage the reuse and dissemination of the material on this site as long as attribution is retained. To this end the material on this site, unless otherwise noted, is offered under Creative Commons Attribution (CC BY 4.0) license