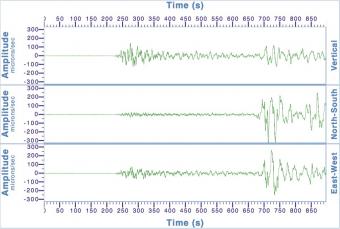
In this activity, students are introduced to the three-component output of an accelerometer as they enter class (or someone jumps next to it). As a whole class students explore how the device records ground motion. Students use circle maps to organize their prior knowledge of seismograms. Next, the students compare the output of the three-component accelerometer with three-component seismic data. To help students understand what the seismic data is illustrating students attempt to move the accelerometer in a way that produces an output similar to the seismogram they see. Building on this, students then apply their prior understanding of seismic waves. Specifically, students consider how the particles are moved as the wave propagates and which axis each wave type would be recorded on most strongly. The activity wraps up asking students to watch security camera footage of a quake and identify when the P, S, and Surface waves arrive based on their new understanding of seismic waves and ground motion.
Students will be able to:
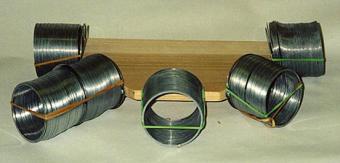
The slinky is an effective tool for the demonstration seismic wave characteristics and wave propagation. Slinkys can be used both individually and in various combinations to demonstration different concepts.
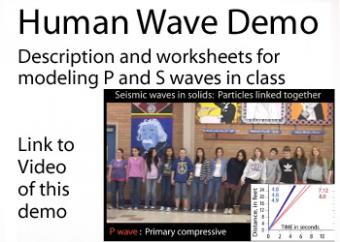
Remember the “stadium wave,” when one person stands and raises his hands in the air and the motion is translated completely around the arena? This simple kinesthetic demonstration uses a similar principal by sending seismic waves through a line of people to illustrate the difference between P waves and S waves propogating through various materials. Lined up shoulder-to-shoulder, students to "become" the material that P and S waves travel through so that once "performed," the principles of seismic waves will not be easily forgotten.
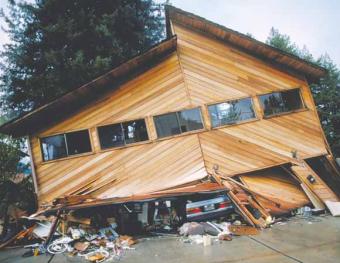
In this activity, students use a three-component accelerometer (iPhone, laptop or USB) to examine their assumptions about how 'hard" the ground shakes during an earthquake.
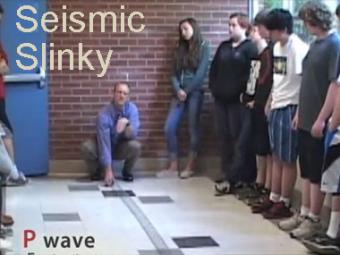
A video demonstration of how a slinky can be a good model for illustrating P & S seismic waves movement.
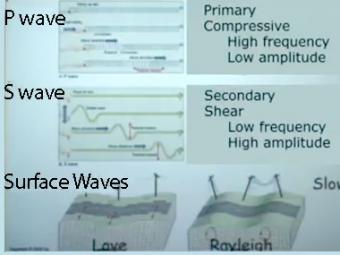
Video lecture on wave propagation and speeds of three fundamental kinds of seismic waves.
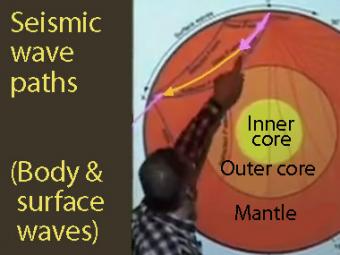
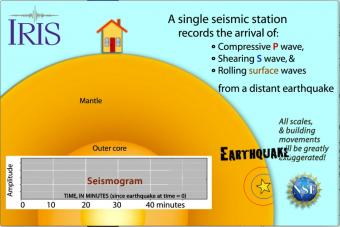
Seismic waves travel through the earth to a single seismic station. Scale and movement of the seismic station are greatly exaggerated to depict the relative motion recorded by the seismogram as P, S, and surface waves arrive.
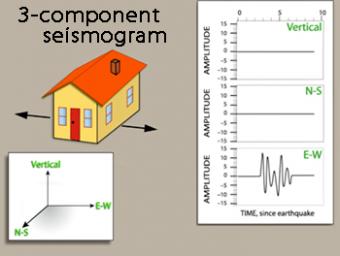
We use exaggerated motion of a building (seismic station) to show how the ground moves during an earthquake, and why it is important to measure seismic waves using 3 components: vertical, N-S, and E-W. Before showing an actual distant earthquake, we break down the three axes of movement to clarify the 3 seismograms.
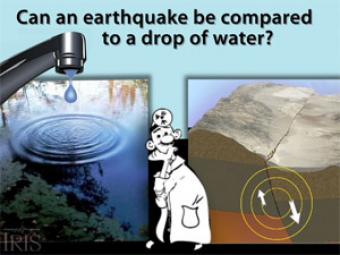
Exploration of how an earthquake is LIKE ripples on/in water. Dr. Geophysics guides you through the simple physics of potential energy and energy release. Analogies are a useful instructional strategy, especially in the science classroom. In this case, the analog is a drop of water hovering above and then falling into a pool of water, while the target is an earthquake.
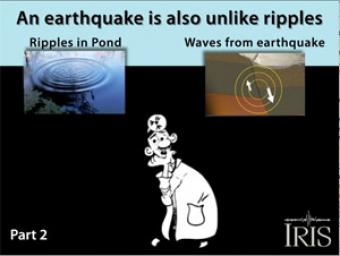
Part 2/2 Comparing seismic waves to ripples in water. This animation explores how seismic waves are UNLIKE ripples on water. Dr. Geophysics helps explain 4 significant differences.
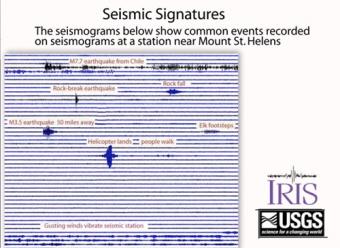
Seismograms of common events are compiled to show the different seismic signals recorded by ground-shaking events. Seismograms can record everything from nearby earthquakes to earthquakes on the other side of the world, plus anything that shakes the ground near the seismograph station like people walking, elk running, rocks falling and helicopters landing.
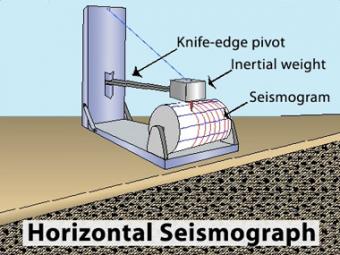
Animation of the principles of a drum-style horizontal seismograph station that records back- and-forth (N-S, E-W) movement.
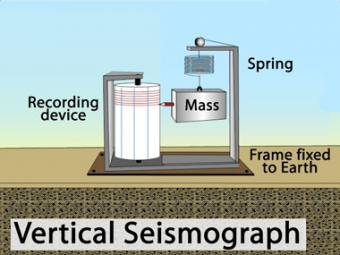
Animation of the principles of a drum-style vertical seismograph station that records up-and-down movement.
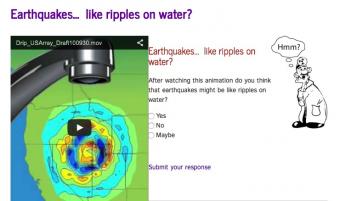
An interactive website, where one can investigate the classic Earth science analogy; "Seismic waves radiate outward from an earthquake's epicenter like ripples on water".
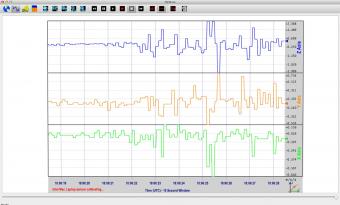
QCNLive is interactive software developed for hands-on education about Earthquake Seismology. There are several modules within QCNLive for learning about earthquake vibrations and where earthquakes occur. The software measures and plots real-time motions acquired from several types of internal and/or external Micro-Electro-Mechanical System (MEMS).
We encourage the reuse and dissemination of the material on this site as long as attribution is retained. To this end the material on this site, unless otherwise noted, is offered under Creative Commons Attribution (CC BY 4.0) license