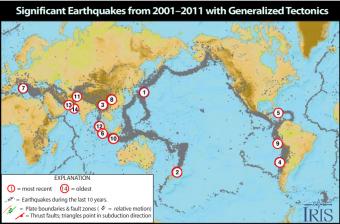
Causes, casualties, and miscellaneous facts about the 14 most-significant earthquakes of that decade. This Flash rollover reveals facts about each of the earthquakes.
ABOUT TO GO AWAY: IRIS is going to discontinue Flash animations in 2020. If you have a Flash player app and would like a copy, download this .swf file.
Rolling over the red-circled numbers reveals the
A beautiful map of the latest earthquakes in near-real time. The map also provides links to related resources, news, and connections to 3D maps.
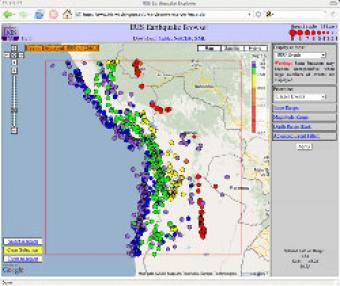
The IRIS Earthquake Browser (IEB) is an interactive tool for exploring millions of seismic event epicenters (normally earthquakes) on a map of the world. Selections of up to 5000 events can also be viewed in 3D and freely rotated with the 3D Viewer companion tool.
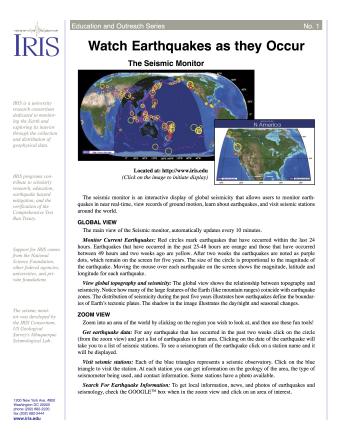
Keep tabs on current seismicity with IRIS's Seismic Monitor. This fact sheet provides an introduction to an interactive display of global seismicity that allows users to monitor earthquakes in near real-time, view records of ground motion, learn about earthquakes, and visit seismic stations around the world.
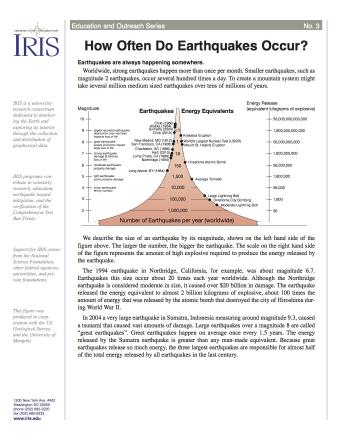
Earth is an active place and earthquakes are always happening somewhere. In fact, the National Earthquake Information Center locates about 12,000-14,000 earthquakes each year! This fact sheet illustrates information on the frequency of earthquakes of various magnitudes, along with details on the effects of earthquakes and the equivalent energy release.
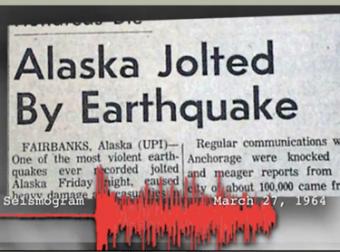
The 1964 Great Alaska Earthquake occurred on Good Friday, March 27th. Liquefaction in and around Anchorage tore the land apart. At magnitude 9.2, it was the second largest quake ever recorded by seismometers.
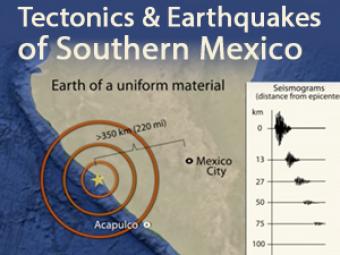
In 1985, a Great, magnitude 8.1 subduction zone earthquake occurred beneath the coast of Michoacan, Mexico causing over 9,000 fatalities over 350 km away. What caused it and how has Mexico instituted their Earthquake Early Warning system? This animation describes the mechanics.
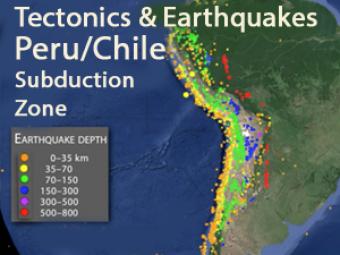
This animation explores three major mechanisms for earthquakes in South America due to the interaction of the Nazca and South American plates.
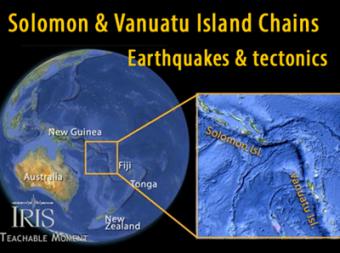
The Solomon and Vanuatu Islands are subduction-related features caused by the subduction of the Indo-Australian Plate beneath the greater Pacific Plate. It is a seismically active area of frequent large earthquakes.
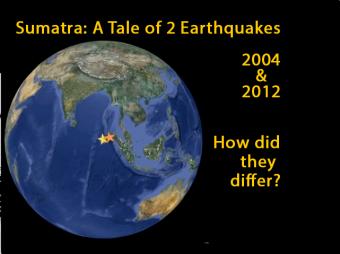
In 2004 a Magnitude 9.1 interplate subduction earthquake triggered a tsunami that killed over 230,000 people. Yet a nearby magnitude 8.7 intraplate earthquake in 2012, caused little damage and generated minimal ocean waves. This animation describes the different tectonic settings of the two plates, and how the Indo-Australian plate seems destined to become two distinct tectonic plates: the Indian and the Australian plates.
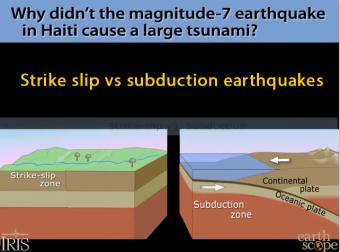
Strike-slips faults like the one that devastated Haiti don't generally cause tsunami, except for small local ripples. The Haiti earthquake was a horizontal motion. Tsunamis are caused by either an uplifting of the ocean floor, or by a huge chunk of land sliding into the ocean. Subduction-zone earthquakes raise the ocean bottom suddenly to push the water in tsunamis.
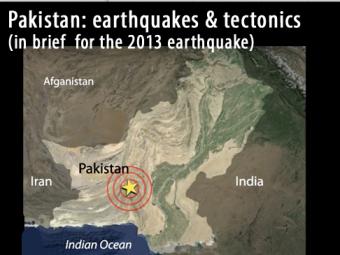
Pakistan is split along the boundary between the Eurasian and Indian plates where the India plate slides northward relative to the Eurasia plate in the east. The Eruasia Plate is also being shoved by the Arabia plate as it subducts northward beneath the Eurasia plate along the boundary south of this map. These motions typically result in north-south to northeast-southwest strike-slip motion.
We encourage the reuse and dissemination of the material on this site as long as attribution is retained. To this end the material on this site, unless otherwise noted, is offered under Creative Commons Attribution (CC BY 4.0) license