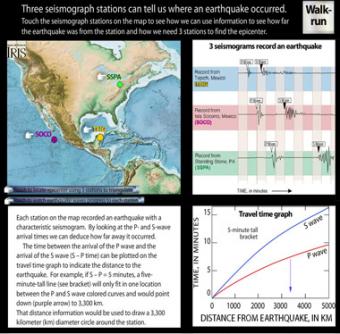
How can I demonstrate seismic wave speed in the classroom? (Hint: Walk/Run)
The arrival times of P and S waves from an earthquake are used to determine the location of an earthquake. Each station on the interactive map recorded an earthquake with a characteristic seismogram. Roll over the stations to see the epicenter triangulated. Touch buttons to watch movie of seismic waves, or touch "Walk-run" button to see wave travel can be demonstrated with a class.
VIEW the interactive in a separate tab, by clicking on "Open Resource". (Note some browsers lack the plugins for rollovers.)
OR click Download All. AFTER downloading, you can Open either:
Rolling over buttons indicated by pointing fingers reveals:
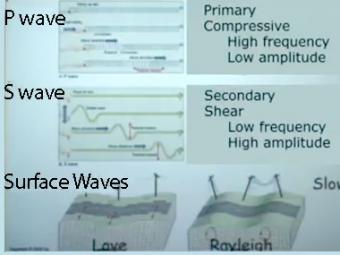
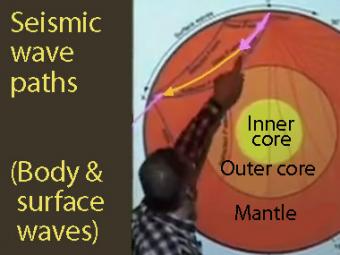
Video lecture on wave propagation and speeds of three fundamental kinds of seismic waves.
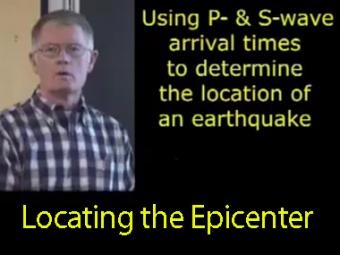
The arrival times of P and S waves are used to determine the distance to an earthquake using standard travel-time curves.
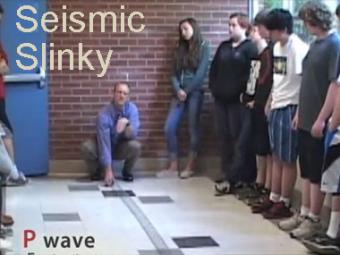
A video demonstration of how a slinky can be a good model for illustrating P & S seismic waves movement.
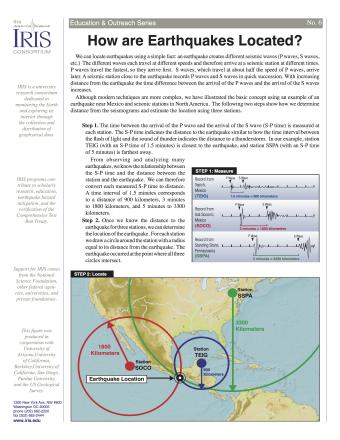
Knowing precisely where an earthquake occurred is an important piece of scientific information. It can help seismologists identify and map seismic hazards. It is also a fundamental piece of information necessary for facilitating studies of Earth's internal structures. This fact sheet provides an overview of the S-P process to locate an earthquake.
NOTE: Out of stock; self-printing only.
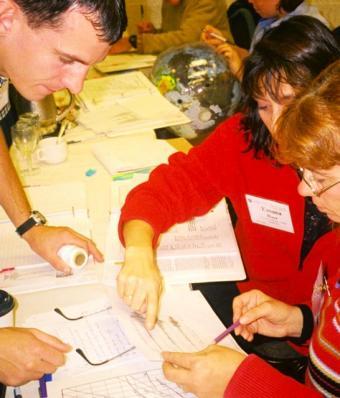
To understand plate tectonic processes and hazards, and to better understand where future earthquakes are likely to occur, it is important to locate earthquakes as they occur. In this activity students use three-component seismic data from recent earthquakes to locate a global earthquake.
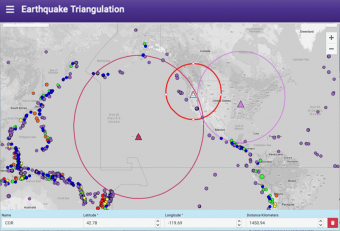
Easily plot stations and distance circles on an interactive world map to demonstrate how earthquakes can be located using the time difference in the arrivals of P and S waves at a set of seismic stations.
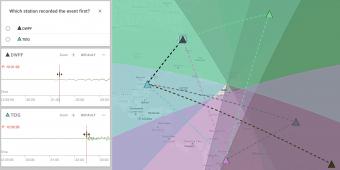
EqLocate is a suite of interactive apps giving users the opportunity to choose their preferred earthquake location method and specific earthquake they want to analyze. Through these easy-to-use tools, learners explore real data from recent and historic seismic events gaining valuable hands-on experience in earthquake locating techniques.
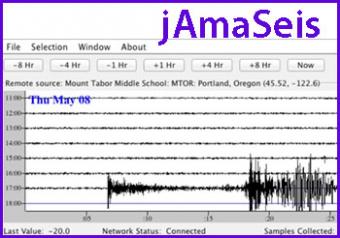
jAmaSeis is a free, java-based program that allows users to obtain and display seismic data in real-time from either a local instrument or from remote stations.
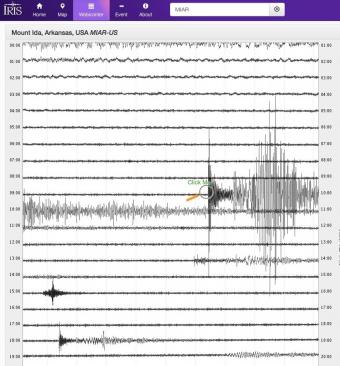
Explore earthquakes near you or from around the globe using the new IRIS Station Monitor app! Select from hundreds of seismic stations throughout the world. View up-to-the-minute recorded ground motions or see recordings from previous days and past events. Get information about recent events and choose to annotate wave arrivals.
We encourage the reuse and dissemination of the material on this site as long as attribution is retained. To this end the material on this site, unless otherwise noted, is offered under Creative Commons Attribution (CC BY 4.0) license