3-Component Seismograph Animation
To save any of the movies on this page to your computer, right click the links labeled "Download Quicktime File" and choose Save Linked File.
Introduction
Most modern seismometers include three separate elements that allow the determination of the simultaneous movement in three different directions: up-down, north-south,and east-west. Following an earthquake, the ground responds to P, S, and surface waves by moving in all directions, and each direction of movement gives information about an earthquake. A seismologist uses the information to determine the general direction of the seismic-wave source, the approximate distance to the source,ground-motion amplitude, and wave-motion characteristics. Measurements from instruments at three or more stations must be combined to locate the earthquake's epicenter and determine the magnitude.
3-Component Seismogram
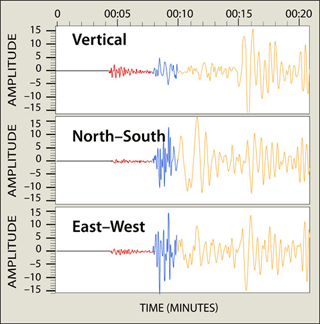
This animation shows both the movement of the three basic waves (P, S, and surface) and the effect of the waves on a building. The three seismograms produced by a modern seismograph station show that the P wave is more visible on the vertical component and the S wave amplitude is larger on the horizontal components.
Download Quicktime File - 6MB Quicktime
Seismic Wave Travel Time
We can locate earthquakes using the simple fact that P, S, and surface waves travel at different speeds, and therefore arrive at a seismic station at different times. P waves travel approximately 1.7 times faster than S waves, so they arrive first. Surface waves are the slowest. A seismic station close to the earthquake records P and S waves in quick succession. As you get farther away from the earthquake the time difference between the arrival of the P waves and the arrival of the S waves increases.
S minus P—arrival times determine distance to earthquake
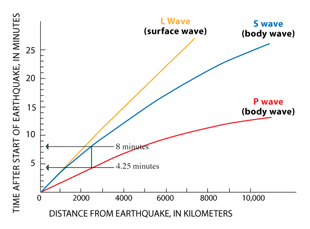
This classic classroom earthquake activity determines the distance to an earthquake from a seismic station by taking advantage of the difference in travel time for P and S waves. We will use the simplest case for an earthquake less than 3,000 miles away. Figure 1 shows a seismogram with the P, S, and surface waves colored using the scheme from the animation above to make arrival times stand out. Figure 2 is a simple Time vs. Distance graph that shows the travel time on the Y axis, against distance from the earthquake on the X axis as measured on the Earth’s surface in miles. The P wave in figure 1 arrived at a station 4 minutes and 15 seconds after the earthquake occurred and the S wave arrived at the station 8 minutes after the earthquake occurred. How far away was the earthquake? Make a vertical line on graph between the two arrival times. It only fits one place.
Watch the introductory lecture below on Reading Travel-Time Curves.
Video lecture on reading travel- time curves by Dr. Robert Butler, University of Portland, as given to a workshop for middle-school Earth- science teachers in June 2006.
Download Quicktime File - 3MB Quicktime
Notes about Triangulation
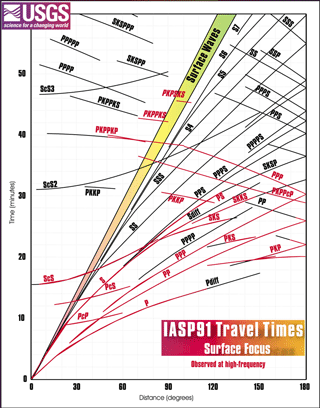
Note, that for a simple classroom activity we use at least three seismic stations and a flat map to triangulate the location of an earthquake. In the real world, triangulation is complicated by the Earth being a sphere, not to mention arrival times being altered by material variations in the Earth, both from place to place and with depth. In addition, seismic waves are not just the three P, S, and surface waves as we depict in our simple model, but are complicated by reflection and refraction of waves within the Earth that produce complex seismograms that lead to the complicated travel-time graph shown in Figure 3.
For education purposes, the simplest examples:
- Use only the P and S waves that
- Arrive at three different stations to locate
- Local earthquakes less than a few hundred miles away.
 Figure 3 - Actual travel times for all of the direct, reflected and refracted seismic waves. This graph is here to show that the world is not as simple as shown in the above animation, but that for education purposes, the simple model suffices. Graph from U.S. Geological Survey.
Animations by Jenda Johnson. Please send any comments or questions to jendaj@gmail.com


