
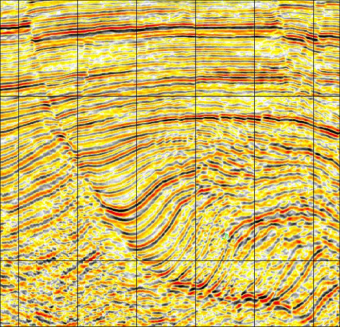
This lesson will help to answer the question: 'What is 3D Seismic Data?'. Students will learn about the advantages of a 3D seismic survey, and how to plan a survey of their own. In addition, students will learn about the techniques used to process 3D seismic data, most notably the method of coherency.
This lesson defines and describes the steps utilized in seismic interpretation: reconaissance, mapping major offsets, mapping horizons, and mapping small-offset faults. After the students have learned about these different steps in detail, they then apply this knowledge to an exercise. With their knowledge and application, the students should be able to generate a geologica framework.
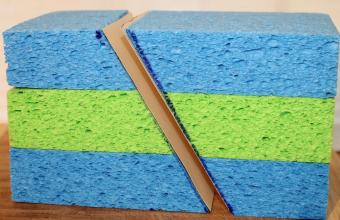
Fault types and rock deformation. The faults and folds in rocks provide evidence that the rocks are subjected to compressional, tensional, and/or shear stress. Silly Putty™ allows students to discover that the structure we see in rocks provides evidence for they type of stress that formed. Students apply this idea by examining images of faults and folds experimentation with sponge models.
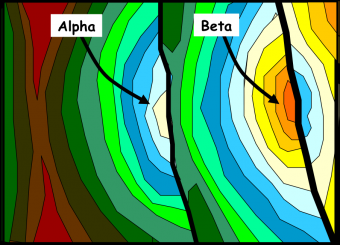
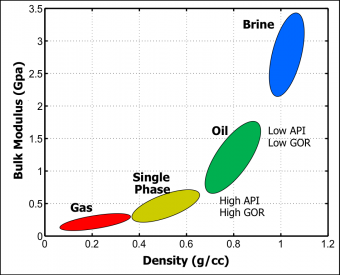
Students will discover how scientists in the oil and gas industry risk a prospect. A manager wants to know what we think is the most likely volume of HC we expect, and the chance that this prospect will actually have that amount of HC. The bigger the possible “prize,” the more risk the manager would be willing to take on. What are the steps that petroleum geoscientists take to examine what the play will produce?
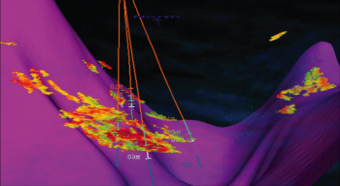

Apply the basics of seismic reflection principles to interpret a geologic framework, conduct a data analysis, prospect for hydrocarbons, and then assess whether the basin should be bid on and provide an economic analysis.
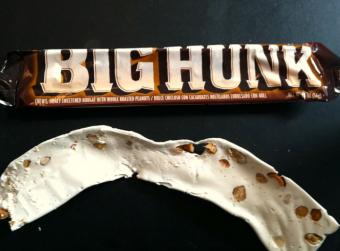
A candy bar, made almost entirely from nougat, is a useful model for connecting strain in rocks to faulting (earthquakes) and folding.
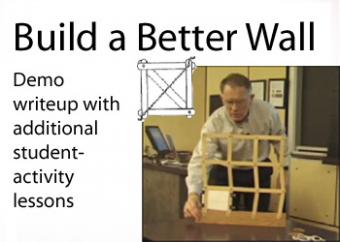
Build a Better wall is an activity developed by FEMA for their "Seismic Sleuths" instructional booklet for students to help with earthquake mitigation. This activity helps students learn how diagonal braces, shear walls, and rigid connections strengthen a structure to carry forces resulting from earthquake shaking.
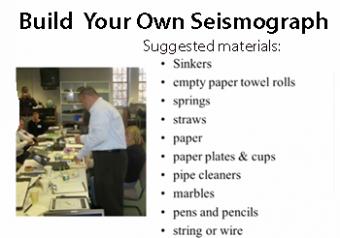
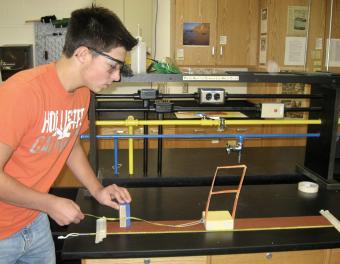
Working in small groups of 3-4, students design and construct a seismograph using common household and craft materials provided. Students will demonstrate to the class (by shaking their table) how their seismographs records ground motion and if possible, the time of the disturbance occured.
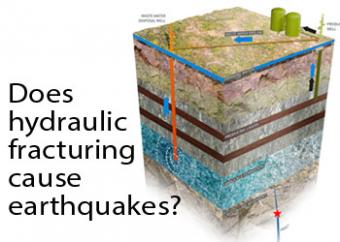
Explore the “hot topic” of induced earthquakes with your students through an activity built on the Argument Driven Inquiry (ADI ) framework that supports three-dimensional learning. Students propose, support, evaluate, and revise ideas through data gathering, argumentation, and discussion.
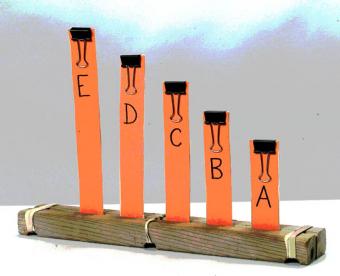
All buildings have a natural frequency of oscillation or resonance frequency. When seismic waves shake the ground beneath a building at its resonance frequency, the structure will begin to sway back and forth. This concept can be demonstrated in the classroom using the BOSS Model Lite as a discrepant event demonstration to engage students in earthquake-engineered buildings.
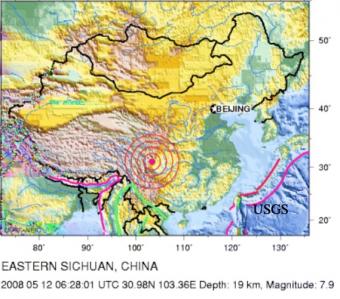
Following a large or newworthy earthquake it is common for many geoscientists to be contacted by the medial. in this role playing activity, using the May 12, 2008 - Sichuan Earthquake as an example students must make an assessment of the earthquake in order to become prepared to discuss the event with the news media.
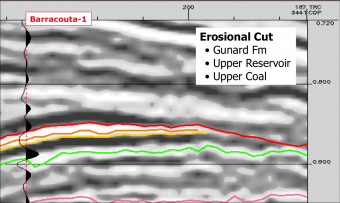
We are ready to plan the development of an offshore field, and thus one or more platforms will be needed to produce the field. Many questions arise, some related to geoscience, engineering, economics, legal, finance, etc. One main difference between exploration and development is scale - exploration looks at a range of stratigraphic intervals over one block to an entire basin, and development knows the stratigraphic interval(s) and works to a much more limited area. Therefore, development geoscientists and stratigraphers have to be more detail-oriented.
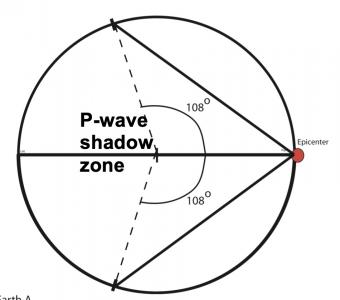
Students work first in small groups, and then as a whole class to compare predicted seismic wave travel times, generated by students from a scaled Earth model, to observed seismic data from a recent earthquakes. This activity uses models, real data and emphasizes the process of science.
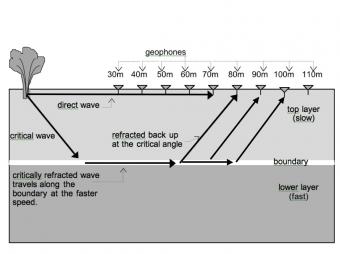
Like other waves, seismic waves obey the laws of physics. In this activity Physics students have the opportunity to apply their understanding of the basic concepts of waves (e.g. reflection, refraction and transmission of energy) as they examine seismic data to determine how far it is from the surface to the bedrock.
This lesson covers the development phase of an asset's life, and also reviews the exploration and production phases of the life cycle. In the exploration phase, there is an opportunity to capture opportunities and discover hydrocarbons through large-scale to finer-scale analyses. The three (3) major considerations in the development phase are: (1) the area and thickness of the oil or gas reserves so we can estimate the volume; (2) the internal architecture of the reservoir rocks; and (3) how the reservoir is broken into separate compartments to be produced. The last stage of an asset's life is the production phase.
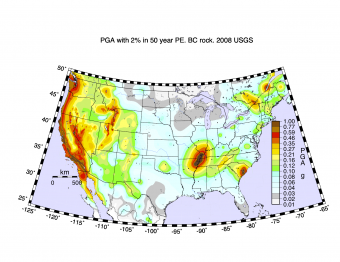
In this activity, students explore of the concept of probability and the distribution of earthquake sizes, and then work to understand how earthquake hazards are described by probabilities. Students then work in small groups to collect and analyze data from a simple physical earthquake model and use online data to investigate and compare the earthquake hazards in California and Missouri.
Using a block-and-sandpaper model, students collaborate in small groups to investigate how energy is stored elastically in rocks and released suddenly as an earthquake (the earthquake cycle). This activity emphasizes the role of mechanical models in understanding and testing ideas in science.
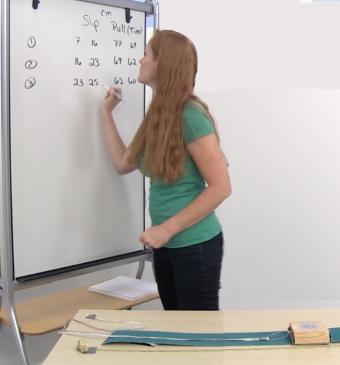
In this activity students use a mechanical fault model to collect empirical data, develop logical arguments about earthquake re-occurrence, and skeptically review other groups arguments.
We encourage the reuse and dissemination of the material on this site as long as attribution is retained. To this end the material on this site, unless otherwise noted, is offered under Creative Commons Attribution (CC BY 4.0) license
 Loading ...