Overview
This is a study of STA/LTA ratios for Transportable Array network stations and a comparison
with stations from the AK, II, IU and US networks. The STA/LTA ratio data is from the
QUACK system, the DMC's automated QC measurement framework.
Quack STA/LTA measurements
Quack's STA/LTA ratios are computed based on a short-term average (STA) of 3 seconds and a
long-term average (LTA) of 30 seconds over 48 overlapping 1-hour windows each day. No
triggering thresholds are involved. Quack reports the maximum STA/LTA ratio and its time
for each window, omitting redundant values from window overlaps.
Developing a Metric for Network Performance
As a daily network metric, raw STA/LTA ratios proved unuseful. Daily network averages were
disproportunately influenced by events such as mass recenters at a single station. In order
for average ratios to be useful, these outliers would have to be removed, making the metric
difficult to automate. Also, useful information was masked by cancelling effects between
stations. For instance, stations with high constant noise levels have relatively small
maximum STA/LTA ratios while stations with frequent impulsive noise have high STA/LTA ratios.
Both types of station are useful to flag, but their signatures were lost in a daily
network average.
A more useful metric involved simulating event triggers by imposing a threshold value and
averaging the number of "triggers" per station across each network. A pilot study showed
that the average STA/LTA ratio over several networks was around 4.5, so I chose 5.0 as a
threshold large enough to omit "background" activity while catching significant values.
Observationally, "triggers" (STA/LTA > 5.0) were typically associated with these events
at a station:
- earthquake phases (affecting all 3 channels)
- impulsive short-period cultural noise (affecting all 3 channels)
- impulsive long-period noise such as wind and tilt (affecting mainly horizontal channels)
- pings from sensor components that aren't moving freely (affecting 1-3 channels)
- mass recenters (affecting 1-3 channels)
Within and across networks, the following was also generally observed:
- local and regional earthquakes triggered at most stations within a regional network,
but not across multiple networks
- teleseisms triggered across all networks
- networks characterized by stations with long-period horizontal noise had more triggers
on horizontal channels than other networks
- networks characterized by quiet stations had roughly the same number of triggers across
all 3 channels
STA/LTA metrics plots:
Based on these observations, these network metrics proved to be the most informative:
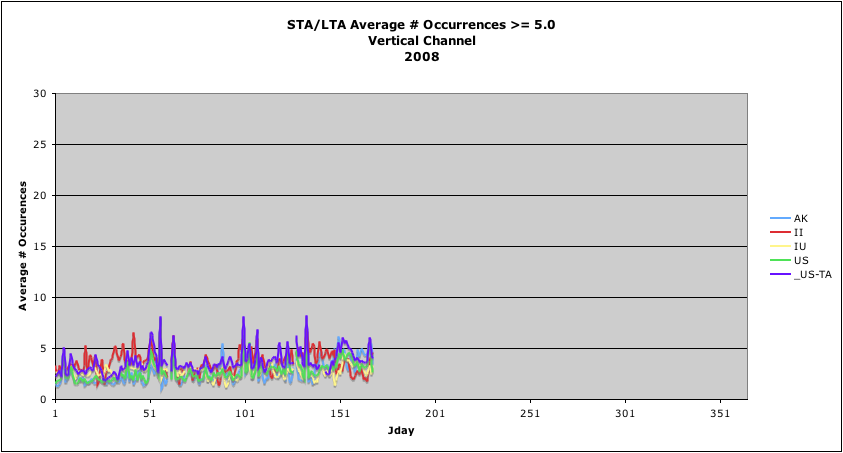
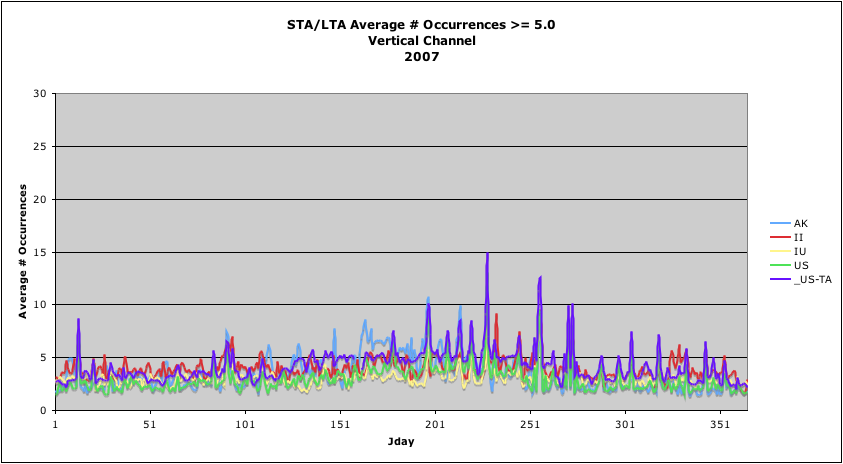
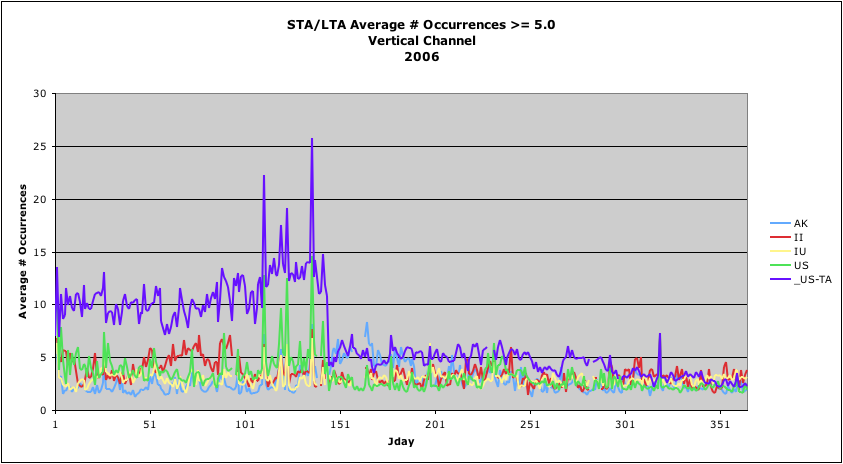
- Average daily number of triggers/station on vertical channels:
This metric comes closest to reflecting the number of earthquake-related triggers,
though impulsive short-period cultural noise can also increase this count.
This metric is the best indication of how well a network is recording
events relative to noise.
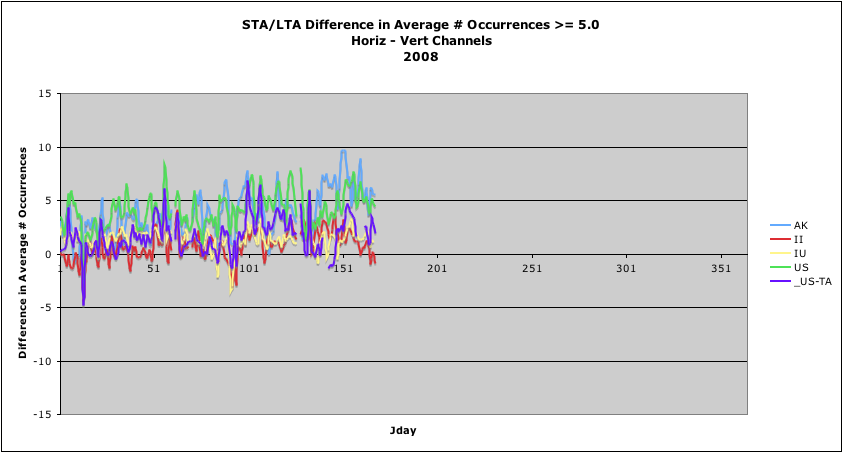
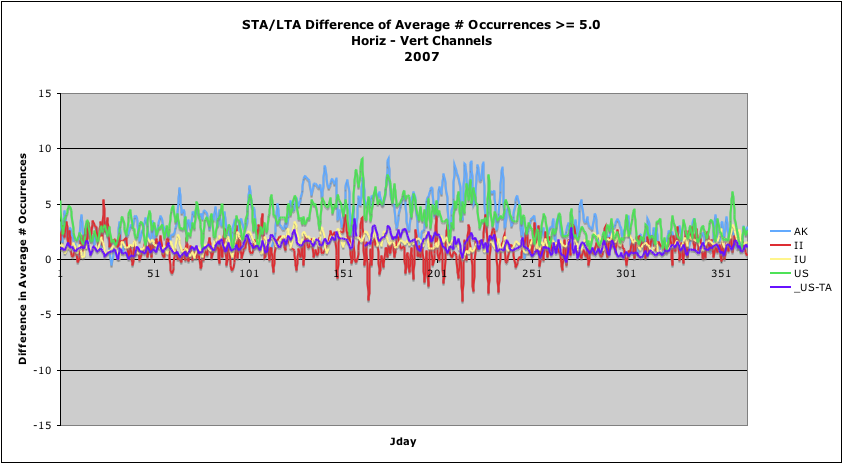
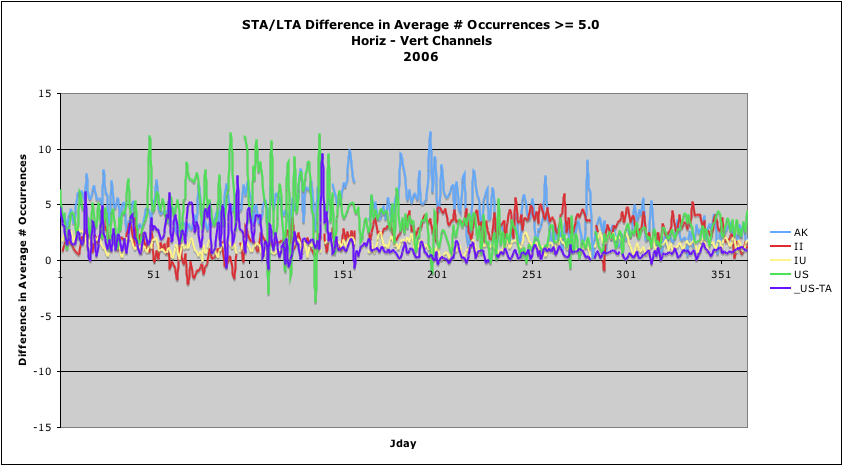
- Difference in average daily number of triggers between horizontal and vertical channels:
This metric is sensitive to the level of long-period horizontal noise characterizing
stations within a network. The closer this metric lies to zero, the less the network
is characterized by horizontal noise. A network's instrumentation and vault type
may influence this metric strongly.
Vertical channels: Average Daily STA/LTA triggers/station
2008 vertical channel STA/LTA ratios (up to day ~170):
2007 vertical channel STA/LTA ratios:
2006 vertical channel STA/LTA ratios:
Horizontal - Vertical Channel Differences: Average Daily STA/LTA triggers/station
2008 Difference in averge # occurrences >= 5.0 between horizontal and vertical channels (up to day ~170):
2007 Difference in averge # occurrences >= 5.0 between horizontal and vertical channels:
2006 Difference in averge # occurrences >= 5.0 between horizontal and vertical channels:
|