Overview
This is a comparison of the 3 sensors used by the Transportable Array TA network stations:
Streckeisen STS-2, Guralp CMG-3T and Nanometrics Trillium-240. The mode of the Probability
Distribution Function (PDF) of the Power Spectral Density is used to characterize the most
common level of background noise for each of these sensors in-situ. To combine the by-station
mode calculations into groups by sensor the mean of the modes is calculated.
PDF data used in this study ranged between September 2004 and October 2008. Each type of
sensor is used in various locations across the Array and there is no known bias in terms of
site construction or installation.
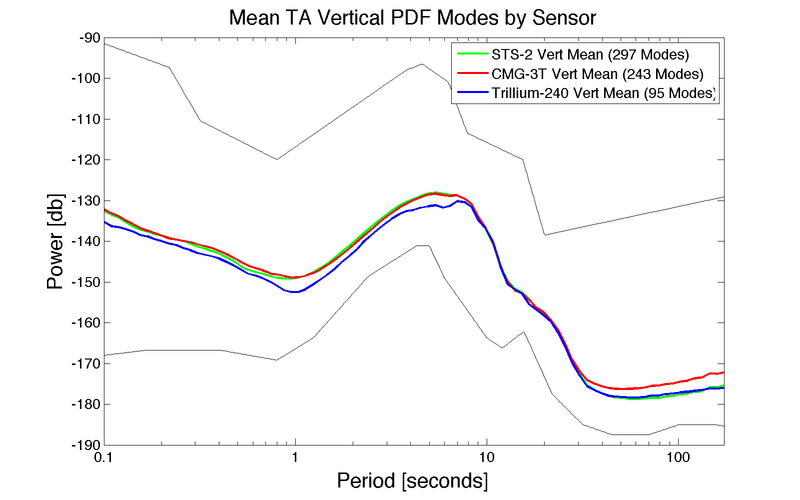
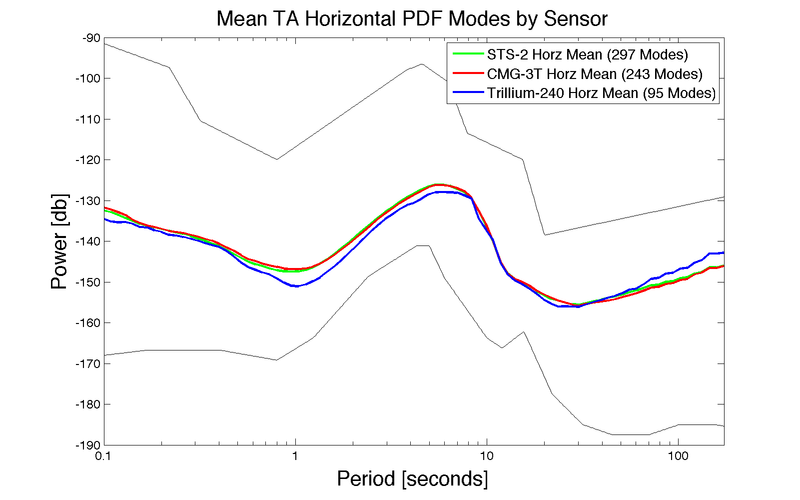
The plots below illustrate that the majority of the TA sites, regardless of sensor, operate at
moderately low noise levels. In general there are not significant differences between sensor
types. The Streckein STS-2's and Guralp CGM-3Ts are very similar in both vertical and horizontal
character with an exception at long periods where, from about 35 seconds and longer, the CMG-3Ts
have a consistently higher noise level than either the STS-2s or Trillium-240s by an average of
4 db. This possbility indicates a higher self noise level at these periods in the CMG-3T than
the other two sensors. The Nanometrics Trillium-240s are consistently at lower or equal noise
levels compared to the other sensors with the exception of long periods, starting at 70 db, for
the horizontal components.
Mean PDF mode by sensor for vertical channels (Peterson new high and low noise models are in gray):
Mean PDF mode by sensor for horizontal channels, (Peterson new high and low noise models are in gray):
|